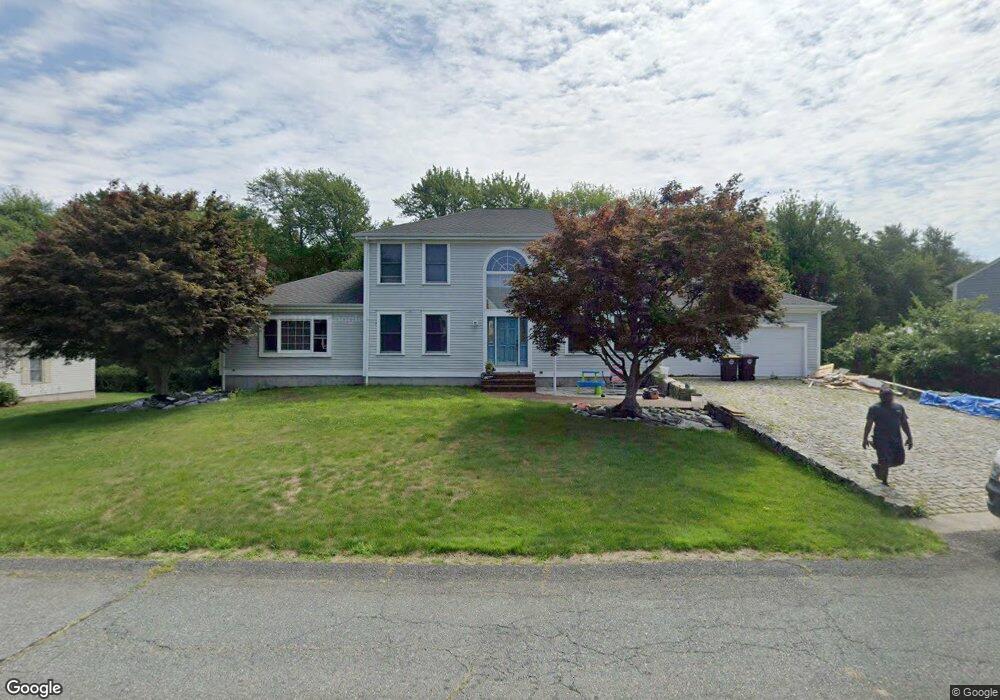
71 Lester Ln Weymouth, MA 02188
Weymouth Landing NeighborhoodEstimated Value: $905,000 - $1,024,000
3
Beds
4
Baths
2,760
Sq Ft
$348/Sq Ft
Est. Value
About This Home
This home is located at 71 Lester Ln, Weymouth, MA 02188 and is currently estimated at $959,205, approximately $347 per square foot. 71 Lester Ln is a home located in Norfolk County with nearby schools including Frederick C Murphy, Abigail Adams Middle School, and Weymouth Middle School Chapman.
Ownership History
Date
Name
Owned For
Owner Type
Purchase Details
Closed on
Dec 23, 2022
Sold by
Massey Maria J and Massey Richard J
Bought by
M & R Ft
Current Estimated Value
Purchase Details
Closed on
Mar 13, 1991
Sold by
Burke William H
Bought by
Massey Richard J and Massey Marie J
Create a Home Valuation Report for This Property
The Home Valuation Report is an in-depth analysis detailing your home's value as well as a comparison with similar homes in the area
Home Values in the Area
Average Home Value in this Area
Purchase History
| Date | Buyer | Sale Price | Title Company |
|---|---|---|---|
| M & R Ft | -- | None Available | |
| Massey Richard J | $125,000 | -- |
Source: Public Records
Mortgage History
| Date | Status | Borrower | Loan Amount |
|---|---|---|---|
| Previous Owner | Massey Richard J | $378,000 | |
| Previous Owner | Massey Richard J | $423,000 |
Source: Public Records
Tax History Compared to Growth
Tax History
| Year | Tax Paid | Tax Assessment Tax Assessment Total Assessment is a certain percentage of the fair market value that is determined by local assessors to be the total taxable value of land and additions on the property. | Land | Improvement |
|---|---|---|---|---|
| 2025 | $9,745 | $964,900 | $237,200 | $727,700 |
| 2024 | $9,536 | $928,500 | $225,900 | $702,600 |
| 2023 | $8,731 | $835,500 | $209,200 | $626,300 |
| 2022 | $8,420 | $734,700 | $193,700 | $541,000 |
| 2021 | $7,971 | $679,000 | $193,700 | $485,300 |
| 2020 | $7,679 | $644,200 | $193,700 | $450,500 |
| 2019 | $7,693 | $634,700 | $203,200 | $431,500 |
| 2018 | $7,589 | $607,100 | $201,600 | $405,500 |
| 2017 | $7,396 | $577,400 | $192,000 | $385,400 |
| 2016 | $7,314 | $571,400 | $184,600 | $386,800 |
| 2015 | $6,987 | $541,600 | $184,600 | $357,000 |
| 2014 | $6,691 | $503,100 | $171,800 | $331,300 |
Source: Public Records
Map
Nearby Homes
- 24 Blake Rd
- 54 Federal St
- 76 Kingman St
- 33 Congress St
- 15 Summer St
- 200 Justin Dr Unit 3
- 116 Belmont St
- 16 Lindbergh Ave
- 230 Lisle St
- 23-25 Lindbergh Ave
- 501 Commerce Dr Unit 2310
- 501 Commerce Dr Unit 1111
- 501 Commerce Dr Unit 4206
- 501 Commerce Dr Unit 4308
- 501 Commerce Dr Unit 4306
- 67 Abby Rd
- 114 Broad St Unit D
- 114 Broad St Unit C
- 11 Richmond St
- 19 Vine St Unit 3