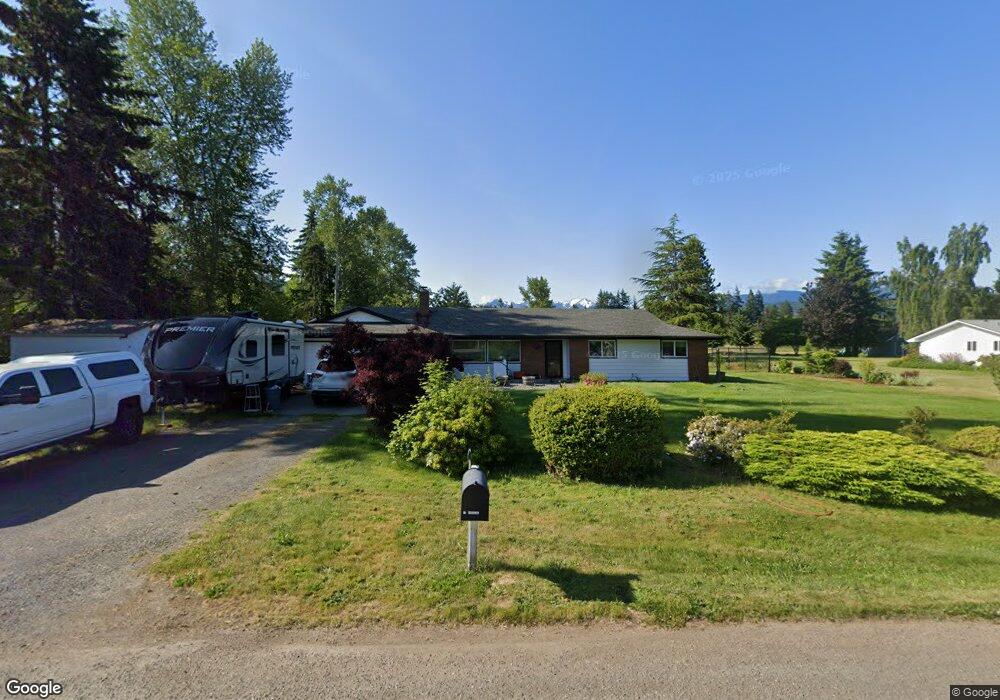
71 Lorraine Dr Sequim, WA 98382
Estimated Value: $490,397 - $532,000
3
Beds
2
Baths
1,886
Sq Ft
$271/Sq Ft
Est. Value
About This Home
This home is located at 71 Lorraine Dr, Sequim, WA 98382 and is currently estimated at $510,799, approximately $270 per square foot. 71 Lorraine Dr is a home located in Clallam County with nearby schools including Greywolf Elementary School, Sequim Middle School, and Sequim Senior High School.
Ownership History
Date
Name
Owned For
Owner Type
Purchase Details
Closed on
Dec 1, 2020
Sold by
Reeder Shannon and Reeder Misty
Bought by
Romero Daniel
Current Estimated Value
Home Financials for this Owner
Home Financials are based on the most recent Mortgage that was taken out on this home.
Original Mortgage
$350,232
Outstanding Balance
$312,367
Interest Rate
2.8%
Mortgage Type
New Conventional
Estimated Equity
$198,432
Purchase Details
Closed on
May 20, 2019
Sold by
Reeder Karen and Parker Karen
Bought by
Reeder Shannon
Purchase Details
Closed on
Sep 22, 2014
Sold by
Schneider Donald L and Schneider Carol J
Bought by
Reeder Shannon and Parker Karen
Home Financials for this Owner
Home Financials are based on the most recent Mortgage that was taken out on this home.
Original Mortgage
$160,000
Interest Rate
4.09%
Mortgage Type
Seller Take Back
Purchase Details
Closed on
Jun 10, 2013
Sold by
Schneider Geraldine
Bought by
Schneider Donald L and Schneider Carol J
Create a Home Valuation Report for This Property
The Home Valuation Report is an in-depth analysis detailing your home's value as well as a comparison with similar homes in the area
Purchase History
| Date | Buyer | Sale Price | Title Company |
|---|---|---|---|
| Romero Daniel | $353,000 | Olympic Peninsula Title Co | |
| Reeder Shannon | -- | Olympic Peninsula Title Co | |
| Reeder Shannon | $200,000 | Olympic Peninsula Title Co | |
| Schneider Donald L | -- | None Available |
Source: Public Records
Mortgage History
| Date | Status | Borrower | Loan Amount |
|---|---|---|---|
| Open | Romero Daniel | $350,232 | |
| Previous Owner | Reeder Shannon | $160,000 |
Source: Public Records
Tax History
| Year | Tax Paid | Tax Assessment Tax Assessment Total Assessment is a certain percentage of the fair market value that is determined by local assessors to be the total taxable value of land and additions on the property. | Land | Improvement |
|---|---|---|---|---|
| 2025 | $3,321 | $444,104 | $80,527 | $363,577 |
| 2023 | $3,321 | $441,554 | $80,527 | $361,027 |
| 2022 | $3,312 | $427,971 | $66,944 | $361,027 |
| 2021 | $2,838 | $359,581 | $53,361 | $306,220 |
| 2020 | $2,933 | $303,985 | $48,510 | $255,475 |
| 2018 | $2,442 | $244,823 | $48,510 | $196,313 |
| 2017 | $2,087 | $220,096 | $48,510 | $171,586 |
| 2016 | $2,117 | $218,866 | $48,510 | $170,356 |
| 2015 | $2,087 | $217,050 | $48,510 | $168,540 |
| 2013 | $2,087 | $187,623 | $54,180 | $133,443 |
| 2012 | $2,087 | $207,042 | $63,000 | $144,042 |
Source: Public Records
Map
Nearby Homes
- 63 Avellana Rd
- 752 River Rd
- 1239 River Rd
- 314 Dungeness Meadows
- 151 Valley View Dr
- 31 Marlo Loop
- 346 Dungeness Meadows
- 9999 Happy Valley Rd
- 4 Gillis Ave
- 2270 S 7th Ave
- 9999 S 7th Ave
- 772 Taylor Cutoff Rd
- 77 Road Less Traveled Way
- 645 Gooseberry Place
- 629 Gooseberry Place
- 621 Gooseberry Place
- 625 Sunbeam Place
- 618 Gooseberry Place
- 579 Silver Frost Dr
- 609 Sunbeam Place
Your Personal Tour Guide
Ask me questions while you tour the home.