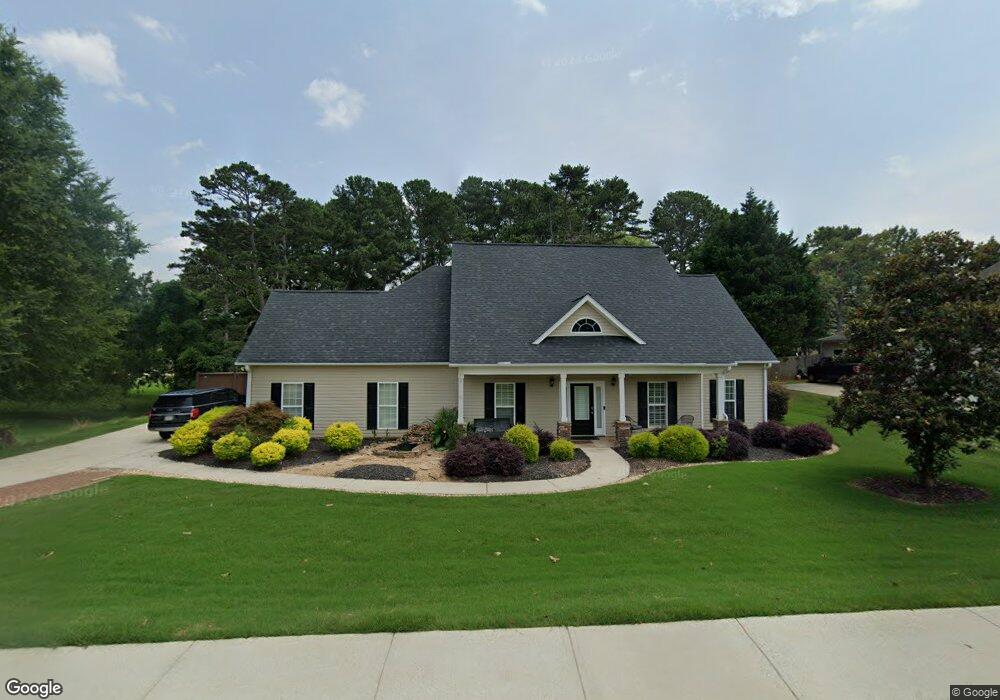
71 Magnolia Pointe Dr Jefferson, GA 30549
Estimated Value: $438,570 - $455,000
--
Bed
2
Baths
2,257
Sq Ft
$198/Sq Ft
Est. Value
About This Home
This home is located at 71 Magnolia Pointe Dr, Jefferson, GA 30549 and is currently estimated at $447,893, approximately $198 per square foot. 71 Magnolia Pointe Dr is a home located in Jackson County with nearby schools including Gum Springs Elementary School, West Jackson Middle School, and Jackson County High School.
Ownership History
Date
Name
Owned For
Owner Type
Purchase Details
Closed on
Jun 18, 2020
Sold by
Brandenburg Thomas Sean
Bought by
Brandenburg Thomas Sean and Brandenburg Tracy Diane
Current Estimated Value
Home Financials for this Owner
Home Financials are based on the most recent Mortgage that was taken out on this home.
Original Mortgage
$216,800
Outstanding Balance
$192,177
Interest Rate
3.2%
Mortgage Type
New Conventional
Estimated Equity
$255,716
Purchase Details
Closed on
Aug 1, 2005
Sold by
Brandenburg Thomas C
Bought by
Brandenburg Thomas Sean
Purchase Details
Closed on
Jun 2, 2004
Sold by
Mcgill Homes Inc
Bought by
Brandenburg Thomas Sean
Purchase Details
Closed on
Sep 29, 2003
Sold by
Jackson Springs Development
Bought by
Mcgill Homes Inc
Purchase Details
Closed on
Feb 8, 2002
Sold by
Mcclure Kathleen
Bought by
Jackson Springs Development Llc
Create a Home Valuation Report for This Property
The Home Valuation Report is an in-depth analysis detailing your home's value as well as a comparison with similar homes in the area
Home Values in the Area
Average Home Value in this Area
Purchase History
| Date | Buyer | Sale Price | Title Company |
|---|---|---|---|
| Brandenburg Thomas Sean | -- | -- | |
| Brandenburg Thomas Sean | -- | -- | |
| Brandenburg Thomas Sean | $164,000 | -- | |
| Mcgill Homes Inc | $36,000 | -- | |
| Jackson Springs Development Llc | $1,082,000 | -- |
Source: Public Records
Mortgage History
| Date | Status | Borrower | Loan Amount |
|---|---|---|---|
| Open | Brandenburg Thomas Sean | $216,800 |
Source: Public Records
Tax History Compared to Growth
Tax History
| Year | Tax Paid | Tax Assessment Tax Assessment Total Assessment is a certain percentage of the fair market value that is determined by local assessors to be the total taxable value of land and additions on the property. | Land | Improvement |
|---|---|---|---|---|
| 2024 | $3,738 | $142,960 | $26,000 | $116,960 |
| 2023 | $3,738 | $125,520 | $26,000 | $99,520 |
| 2022 | $3,158 | $107,680 | $26,000 | $81,680 |
| 2021 | $2,737 | $92,560 | $16,000 | $76,560 |
| 2020 | $2,837 | $87,880 | $16,000 | $71,880 |
| 2019 | $2,878 | $87,880 | $16,000 | $71,880 |
| 2018 | $2,800 | $84,440 | $16,000 | $68,440 |
| 2017 | $2,677 | $80,071 | $16,000 | $64,071 |
| 2016 | $2,445 | $72,700 | $16,000 | $56,700 |
| 2015 | $2,175 | $64,700 | $8,000 | $56,700 |
| 2014 | $1,921 | $56,989 | $8,000 | $48,989 |
| 2013 | -- | $56,989 | $8,000 | $48,989 |
Source: Public Records
Map
Nearby Homes
- 77 Wildcherry Ct
- 113 Skelton Rd
- 86 Cottonwood Rd
- 257 Winding Ridge Trail
- 257 Winding Ridge Trail Unit LOT 14
- 982 Wildberry Ct
- 241 Winding Ridge Trail Unit LOT 13
- 241 Winding Ridge Trail
- 227 Winding Ridge Trail Unit LOT 12
- 227 Winding Ridge Trail
- 211 Winding Ridge Trail Unit LOT 11
- 211 Winding Ridge Trail
- 195 Winding Ridge Trail Unit LOT 10
- 195 Winding Ridge Trail
- 179 Winding Ridge Trail
- 179 Winding Ridge Trail Unit LOT 9
- 163 Winding Ridge Trail Unit LOT 8
- 163 Winding Ridge Trail
- 920 Traditions Way
- 147 Winding Ridge Trail
- 91 Magnolia Pointe Dr
- 21 Magnolia Pointe Dr
- 113 Magnolia Pointe Dr 0
- 113 Magnolia Pointe Dr
- 18 Chickasaw Trail
- 168 Buckthorn Dr
- 50 Magnolia Pointe Dr
- 96 Buroak Dr
- 74 Buroak Dr
- 30 Buroak Dr
- 0 Buroak Dr Unit 7292857
- 0 Buroak Dr Unit 3281126
- 0 Buroak Dr Unit 8802641
- 0 Buroak Dr Unit 8683112
- 0 Buroak Dr Unit 3253468
- 96 Buroak Dr
- 10 Magnolia Pointe Dr
- 133 Magnolia Pointe Dr
- 122 Buroak Dr
- 48 Chickasaw Trail