Estimated Value: $689,000 - $1,027,000
4
Beds
3
Baths
2,830
Sq Ft
$289/Sq Ft
Est. Value
About This Home
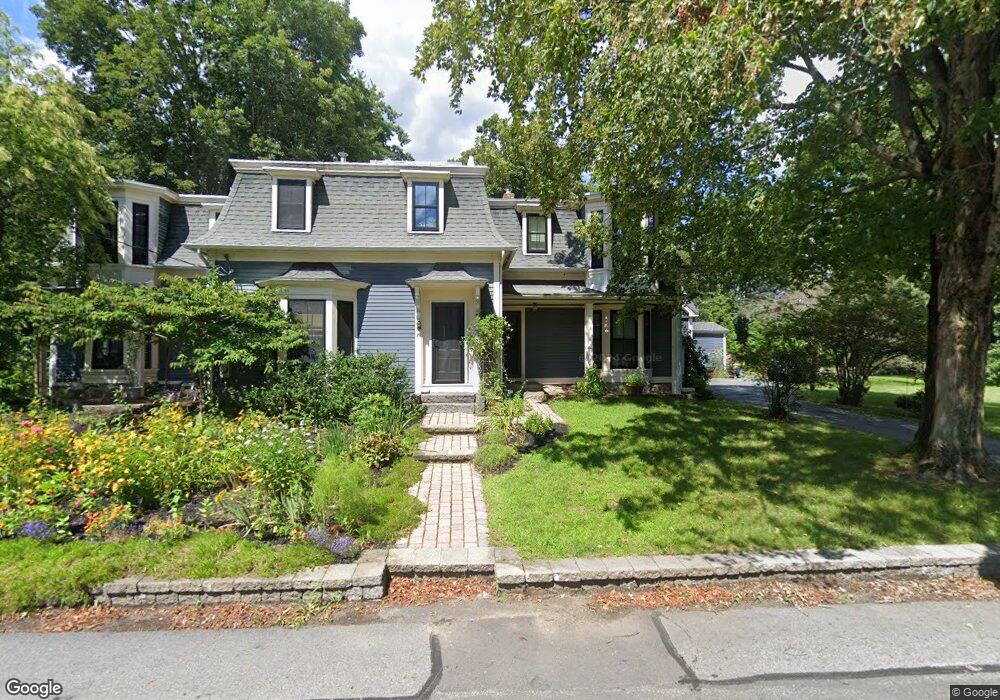
This home is located at 71 Maple St, Acton, MA 01720 and is currently estimated at $818,771, approximately $289 per square foot. 71 Maple St is a home located in Middlesex County with nearby schools including Acton-Boxborough Regional High School, Maynard Knowledge Beginnings, and The Imago School.
Ownership History
Date
Name
Owned For
Owner Type
Purchase Details
Closed on
Jun 27, 2025
Sold by
Shanley Harry T and Miley Margaret
Bought by
Miley Margaret
Current Estimated Value
Purchase Details
Closed on
May 29, 1998
Sold by
Korde Shirish and Korde Margaret G
Bought by
Miley Margaretm and Shanley Harry T
Home Financials for this Owner
Home Financials are based on the most recent Mortgage that was taken out on this home.
Original Mortgage
$217,500
Interest Rate
7.12%
Mortgage Type
Purchase Money Mortgage
Create a Home Valuation Report for This Property
The Home Valuation Report is an in-depth analysis detailing your home's value as well as a comparison with similar homes in the area
Home Values in the Area
Average Home Value in this Area
Purchase History
| Date | Buyer | Sale Price | Title Company |
|---|---|---|---|
| Miley Margaret | -- | -- | |
| Miley Margaret | -- | -- | |
| Miley Margaretm | $290,000 | -- | |
| Miley Margaretm | $290,000 | -- |
Source: Public Records
Mortgage History
| Date | Status | Borrower | Loan Amount |
|---|---|---|---|
| Previous Owner | Miley Margaretm | $42,300 | |
| Previous Owner | Miley Margaretm | $217,500 |
Source: Public Records
Tax History
| Year | Tax Paid | Tax Assessment Tax Assessment Total Assessment is a certain percentage of the fair market value that is determined by local assessors to be the total taxable value of land and additions on the property. | Land | Improvement |
|---|---|---|---|---|
| 2025 | $12,425 | $724,500 | $299,300 | $425,200 |
| 2024 | $12,081 | $724,700 | $299,300 | $425,400 |
| 2023 | $12,232 | $696,600 | $286,600 | $410,000 |
| 2022 | $11,787 | $606,000 | $248,900 | $357,100 |
| 2021 | $11,400 | $563,500 | $230,700 | $332,800 |
| 2020 | $10,969 | $570,100 | $230,700 | $339,400 |
| 2019 | $10,318 | $532,700 | $230,700 | $302,000 |
| 2018 | $10,194 | $526,000 | $230,700 | $295,300 |
| 2017 | $9,816 | $515,000 | $230,700 | $284,300 |
| 2016 | $9,819 | $510,600 | $230,700 | $279,900 |
| 2015 | $9,616 | $504,800 | $230,700 | $274,100 |
| 2014 | $9,390 | $482,800 | $230,700 | $252,100 |
Source: Public Records
Map
Nearby Homes
- 131 Main St
- 182 Main St Unit 4
- 6 Beacon Ct
- 184 Main St Unit 3
- 40 High St
- 70 River St
- 112 High St
- 1 Vanderbelt Rd
- 90 Willow St Unit 1
- 92 Willow St Unit 3
- 92 Willow St Unit 2
- 63 Conant St
- 12 Joseph Reed Ln
- 235 Arlington St
- 20 Joseph Reed Ln
- 631 Massachusetts Ave Unit 631
- 36 Brown St
- 130 Parker St Unit J2
- 1 Carlton Dr
- 1 Drummer Rd Unit A5
Your Personal Tour Guide
Ask me questions while you tour the home.