
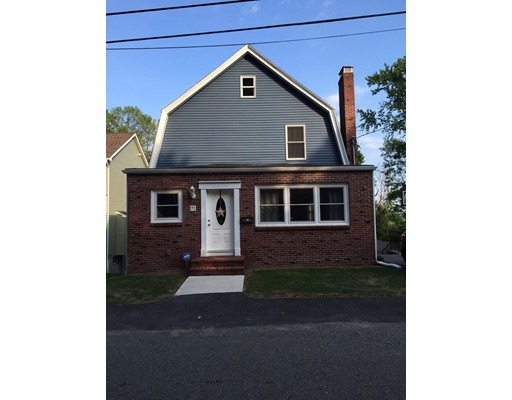
71 Marshall St N Revere, MA 02151
West Revere Neighborhood
3
Beds
2
Baths
2,190
Sq Ft
6,534
Sq Ft Lot
About This Home
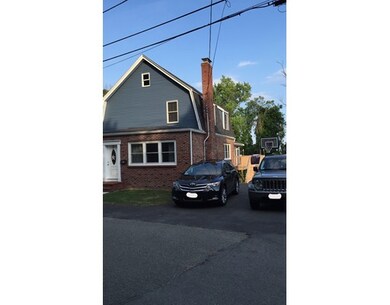
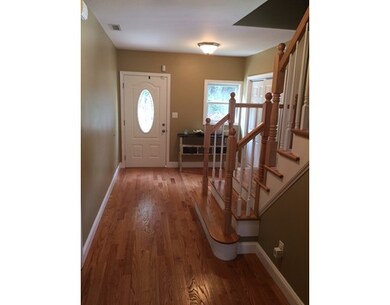
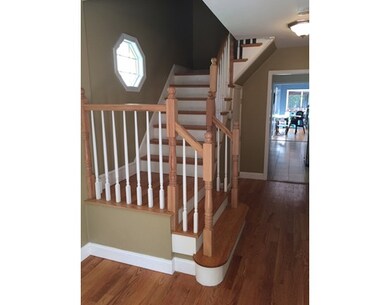
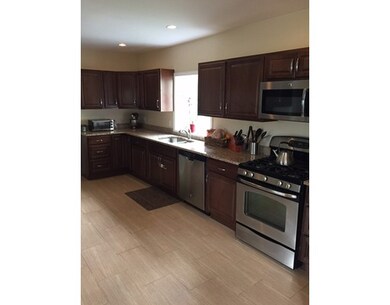
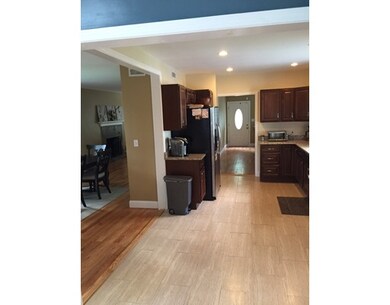
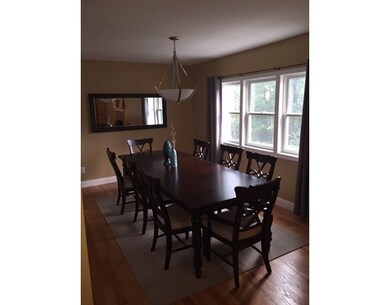
As of March 2016GREAT LOCATION NORTH REVERE AREA, BEAUTIFUL SINGLE FAMILY. HARDWOOD FLOORS IN LIVING ROOM WITH A WORKING STONE FIREPLACE, SPACIOUS DINNING ROOM,CATHEDRAL CEILINGS FAMILY ROOM FOR EXTRA NATURAL LIGHTS, FENCED BACKYARD, PLENTY OF CLOSETS, CENTRAL AC, 2 FULL BATHROOM, GRANITE COUNTER AND SS APPLIANCES
Home Details
Home Type
Single Family
Est. Annual Taxes
$6,259
Year Built
1881
Lot Details
0
Listing Details
- Lot Description: Other (See Remarks)
- Other Agent: 2.00
- Special Features: None
- Property Sub Type: Detached
- Year Built: 1881
Interior Features
- Appliances: Range, Dishwasher, Disposal, Microwave, Refrigerator - ENERGY STAR
- Fireplaces: 1
- Has Basement: Yes
- Fireplaces: 1
- Number of Rooms: 6
- Flooring: Hardwood
- Basement: Full, Walk Out
Exterior Features
- Exterior: Vinyl, Brick
- Exterior Features: Porch, Fenced Yard
- Foundation: Fieldstone
Garage/Parking
- Parking: Off-Street
- Parking Spaces: 2
Utilities
- Cooling: Central Air
- Heating: Hot Water Baseboard, Gas
- Hot Water: Natural Gas
Lot Info
- Assessor Parcel Number: M:31 B:484-485 L:11
Ownership History
Date
Name
Owned For
Owner Type
Purchase Details
Listed on
Aug 28, 2015
Closed on
Mar 18, 2016
Sold by
Mora Diana
Bought by
Cunha Tarcisio and Gonzaga Kitia
Seller's Agent
Borinquen Jimenez
Madelyn Garcia Real Estate
Buyer's Agent
Kathryn Raymond
eXp Realty
List Price
$399,900
Sold Price
$399,900
Current Estimated Value
Home Financials for this Owner
Home Financials are based on the most recent Mortgage that was taken out on this home.
Estimated Appreciation
$389,482
Avg. Annual Appreciation
6.90%
Original Mortgage
$392,653
Interest Rate
3.37%
Mortgage Type
FHA
Purchase Details
Listed on
Oct 29, 2013
Closed on
Mar 28, 2014
Sold by
Lightbody Charles A
Bought by
Mora Diana
Seller's Agent
Peggy Calle
Century 21 North East
Buyer's Agent
Borinquen Jimenez
Madelyn Garcia Real Estate
List Price
$389,900
Sold Price
$370,000
Premium/Discount to List
-$19,900
-5.1%
Home Financials for this Owner
Home Financials are based on the most recent Mortgage that was taken out on this home.
Avg. Annual Appreciation
4.00%
Original Mortgage
$330,000
Interest Rate
4.27%
Mortgage Type
New Conventional
Purchase Details
Listed on
Jun 19, 2012
Closed on
Jun 26, 2013
Sold by
Keller Scott M and Keller Carroll F
Bought by
Lightbody Charles A
Seller's Agent
Daniel Meegan
J. Barrett & Company
Buyer's Agent
Daniel Meegan
J. Barrett & Company
List Price
$250,000
Sold Price
$142,000
Premium/Discount to List
-$108,000
-43.2%
Home Financials for this Owner
Home Financials are based on the most recent Mortgage that was taken out on this home.
Avg. Annual Appreciation
252.58%
Purchase Details
Closed on
Jun 23, 2003
Sold by
Keller Victor S and Keller Misha Y
Bought by
Keller Scott M and Keller Carroll F
Purchase Details
Closed on
May 4, 1998
Sold by
Castinetti Chester L and Cstinetti Margaret C
Bought by
Keller Victor S and Keller Misha Y
Similar Homes in Revere, MA
Create a Home Valuation Report for This Property
The Home Valuation Report is an in-depth analysis detailing your home's value as well as a comparison with similar homes in the area
Home Values in the Area
Average Home Value in this Area
Purchase History
| Date | Type | Sale Price | Title Company |
|---|---|---|---|
| Not Resolvable | $399,900 | -- | |
| Not Resolvable | $370,000 | -- | |
| Not Resolvable | $142,000 | -- | |
| Deed | $299,900 | -- | |
| Deed | $299,900 | -- | |
| Deed | $164,000 | -- | |
| Deed | $164,000 | -- |
Source: Public Records
Mortgage History
| Date | Status | Loan Amount | Loan Type |
|---|---|---|---|
| Open | $360,000 | Stand Alone Refi Refinance Of Original Loan | |
| Closed | $392,653 | FHA | |
| Previous Owner | $330,000 | New Conventional |
Source: Public Records
Property History
| Date | Event | Price | Change | Sq Ft Price |
|---|---|---|---|---|
| 03/18/2016 03/18/16 | Sold | $399,900 | 0.0% | $183 / Sq Ft |
| 01/25/2016 01/25/16 | Pending | -- | -- | -- |
| 01/13/2016 01/13/16 | For Sale | $399,900 | 0.0% | $183 / Sq Ft |
| 11/16/2015 11/16/15 | Pending | -- | -- | -- |
| 11/04/2015 11/04/15 | Price Changed | $399,900 | -5.9% | $183 / Sq Ft |
| 10/26/2015 10/26/15 | Price Changed | $424,900 | -1.2% | $194 / Sq Ft |
| 10/16/2015 10/16/15 | Price Changed | $429,900 | -3.4% | $196 / Sq Ft |
| 10/02/2015 10/02/15 | Price Changed | $444,900 | -1.0% | $203 / Sq Ft |
| 09/15/2015 09/15/15 | Price Changed | $449,500 | +0.1% | $205 / Sq Ft |
| 08/28/2015 08/28/15 | For Sale | $449,000 | +21.4% | $205 / Sq Ft |
| 03/28/2014 03/28/14 | Sold | $370,000 | -4.9% | $169 / Sq Ft |
| 02/04/2014 02/04/14 | Pending | -- | -- | -- |
| 01/09/2014 01/09/14 | Price Changed | $389,000 | -0.2% | $178 / Sq Ft |
| 12/18/2013 12/18/13 | For Sale | $389,900 | +5.4% | $178 / Sq Ft |
| 11/30/2013 11/30/13 | Pending | -- | -- | -- |
| 11/18/2013 11/18/13 | Off Market | $370,000 | -- | -- |
| 10/29/2013 10/29/13 | For Sale | $389,900 | +174.6% | $178 / Sq Ft |
| 06/25/2013 06/25/13 | Sold | $142,000 | -8.4% | $65 / Sq Ft |
| 05/14/2013 05/14/13 | Pending | -- | -- | -- |
| 02/01/2013 02/01/13 | Price Changed | $155,000 | -11.4% | $71 / Sq Ft |
| 08/13/2012 08/13/12 | Price Changed | $175,000 | -12.5% | $80 / Sq Ft |
| 07/30/2012 07/30/12 | Price Changed | $199,900 | -9.1% | $91 / Sq Ft |
| 07/11/2012 07/11/12 | Price Changed | $219,900 | -12.0% | $100 / Sq Ft |
| 06/29/2012 06/29/12 | For Sale | $250,000 | +76.1% | $114 / Sq Ft |
| 06/23/2012 06/23/12 | Off Market | $142,000 | -- | -- |
| 06/19/2012 06/19/12 | For Sale | $250,000 | -- | $114 / Sq Ft |
Source: MLS Property Information Network (MLS PIN)
Tax History Compared to Growth
Tax History
| Year | Tax Paid | Tax Assessment Tax Assessment Total Assessment is a certain percentage of the fair market value that is determined by local assessors to be the total taxable value of land and additions on the property. | Land | Improvement |
|---|---|---|---|---|
| 2025 | $6,259 | $690,100 | $292,600 | $397,500 |
| 2024 | $6,096 | $669,100 | $276,300 | $392,800 |
| 2023 | $5,836 | $613,700 | $230,800 | $382,900 |
| 2022 | $5,772 | $555,000 | $219,400 | $335,600 |
| 2021 | $5,520 | $499,100 | $203,200 | $295,900 |
| 2020 | $5,620 | $499,100 | $203,200 | $295,900 |
| 2019 | $5,491 | $453,400 | $185,300 | $268,100 |
| 2018 | $5,258 | $405,700 | $167,400 | $238,300 |
| 2017 | $5,866 | $419,300 | $146,300 | $273,000 |
| 2016 | $5,333 | $369,100 | $133,300 | $235,800 |
| 2015 | $5,463 | $369,100 | $133,300 | $235,800 |
Source: Public Records
Agents Affiliated with this Home
-
Seller's Agent in 2016
Borinquen Jimenez
Madelyn Garcia Real Estate
(617) 839-3202
4 in this area
37 Total Sales
-
Buyer's Agent in 2016
Kathryn Raymond
eXp Realty
(617) 816-5492
16 Total Sales
-
Seller's Agent in 2014
Peggy Calle
Century 21 North East
(617) 438-5355
34 in this area
80 Total Sales
-
Seller's Agent in 2013
Daniel Meegan
J. Barrett & Company
(617) 388-8500
73 Total Sales
Map
Source: MLS Property Information Network (MLS PIN)
MLS Number: 71896131
APN: REVE-000031-484485-000011
Disclaimer: Certain information contained herein is derived from information provided by parties other than Homes.com. All information provided is deemed reliable, but is not guaranteed to be accurate and should be independently verified.
![]() The property listing data and information, or the Images, set forth herein were provided to MLS Property Information Network, Inc. from third party sources, including sellers, lessors and public records, and were compiled by MLS Property Information Network, Inc. The property listing data and information, and the Images, are for the personal, non-commercial use of consumers having a good faith interest in purchasing or leasing listed properties of the type displayed to them and may not be used for any purpose other than to identify prospective properties which such consumers may have a good faith interest in purchasing or leasing. MLS Property Information Network, Inc. and its subscribers disclaim any and all representations and warranties as to the accuracy of the property listing data and information, or as to the accuracy of any of the Images, set forth herein.
The property listing data and information, or the Images, set forth herein were provided to MLS Property Information Network, Inc. from third party sources, including sellers, lessors and public records, and were compiled by MLS Property Information Network, Inc. The property listing data and information, and the Images, are for the personal, non-commercial use of consumers having a good faith interest in purchasing or leasing listed properties of the type displayed to them and may not be used for any purpose other than to identify prospective properties which such consumers may have a good faith interest in purchasing or leasing. MLS Property Information Network, Inc. and its subscribers disclaim any and all representations and warranties as to the accuracy of the property listing data and information, or as to the accuracy of any of the Images, set forth herein.
Nearby Homes
- 133 Salem St Unit 214
- 133 Salem St Unit 307
- 133 Salem St Unit 304
- 133 Salem St Unit 418
- 133 Salem St Unit 207
- 133 Salem St Unit 213
- 133 Salem St Unit 408
- 133 Salem St Unit 410
- 133 Salem St Unit 414
- 133 Salem St Unit 416
- 133 Salem St Unit 407
- 133 Salem St Unit 206
- 133 Salem St Unit 117
- 133 Salem St Unit U312
- 133 Salem St Unit 116
- 133 Salem St Unit 412
- 133 Salem St Unit 310
- 133 Salem St Unit 301
- 133 Salem St Unit 406
- 133 Salem St Unit 302