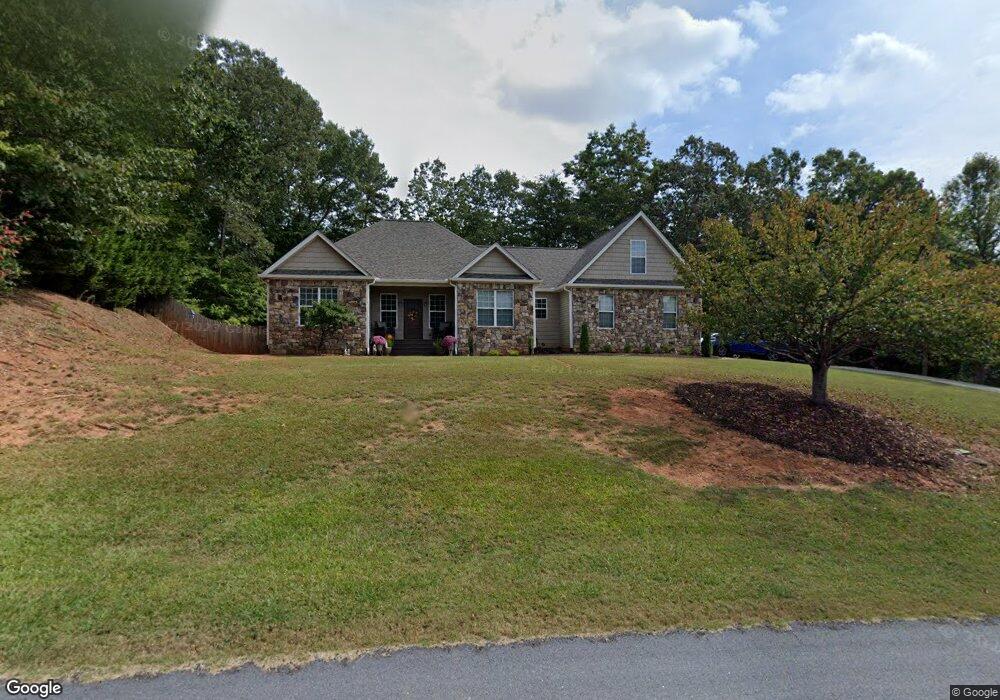
71 Misty Way Dahlonega, GA 30533
Estimated Value: $500,000 - $648,000
3
Beds
3
Baths
2,131
Sq Ft
$258/Sq Ft
Est. Value
About This Home
This home is located at 71 Misty Way, Dahlonega, GA 30533 and is currently estimated at $550,863, approximately $258 per square foot. 71 Misty Way is a home located in Lumpkin County with nearby schools including Lumpkin County High School.
Ownership History
Date
Name
Owned For
Owner Type
Purchase Details
Closed on
Mar 10, 2022
Sold by
Longino Sandra Dawn
Bought by
Havel Gary G and Havel Dana Everetts
Current Estimated Value
Home Financials for this Owner
Home Financials are based on the most recent Mortgage that was taken out on this home.
Original Mortgage
$380,000
Outstanding Balance
$355,043
Interest Rate
3.92%
Mortgage Type
New Conventional
Estimated Equity
$195,821
Purchase Details
Closed on
Mar 29, 2017
Sold by
Longino Anthony Grant
Bought by
Longino Sandra Dawn
Purchase Details
Closed on
Dec 10, 2014
Sold by
Lee Jeannette
Bought by
Logino Anthony Grant
Purchase Details
Closed on
Mar 28, 2005
Sold by
Nahlik Leo
Bought by
Lee Bernard W
Purchase Details
Closed on
Oct 23, 2003
Sold by
Century Properties & Developme
Bought by
Nahlik Leo
Purchase Details
Closed on
Jan 3, 2001
Sold by
Greenway J D
Bought by
Century Properties & Development
Create a Home Valuation Report for This Property
The Home Valuation Report is an in-depth analysis detailing your home's value as well as a comparison with similar homes in the area
Home Values in the Area
Average Home Value in this Area
Purchase History
| Date | Buyer | Sale Price | Title Company |
|---|---|---|---|
| Havel Gary G | $475,000 | -- | |
| Longino Sandra Dawn | -- | -- | |
| Logino Anthony Grant | -- | -- | |
| Lee Bernard W | $263,000 | -- | |
| Nahlik Leo | $30,000 | -- | |
| Century Properties & Development | $200,000 | -- |
Source: Public Records
Mortgage History
| Date | Status | Borrower | Loan Amount |
|---|---|---|---|
| Open | Havel Gary G | $380,000 |
Source: Public Records
Tax History Compared to Growth
Tax History
| Year | Tax Paid | Tax Assessment Tax Assessment Total Assessment is a certain percentage of the fair market value that is determined by local assessors to be the total taxable value of land and additions on the property. | Land | Improvement |
|---|---|---|---|---|
| 2024 | $1,496 | $160,351 | $14,000 | $146,351 |
| 2023 | $1,020 | $150,882 | $14,000 | $136,882 |
| 2022 | $4,253 | $140,910 | $14,000 | $126,910 |
| 2021 | $3,881 | $120,625 | $14,000 | $106,625 |
| 2020 | $3,935 | $117,769 | $14,000 | $103,769 |
| 2019 | $3,955 | $117,769 | $14,000 | $103,769 |
| 2018 | $3,730 | $104,117 | $14,000 | $90,117 |
| 2017 | $3,614 | $99,295 | $14,000 | $85,295 |
| 2016 | $3,415 | $91,923 | $14,000 | $77,923 |
| 2015 | $3,003 | $91,923 | $14,000 | $77,923 |
| 2014 | $3,003 | $92,789 | $14,000 | $78,789 |
| 2013 | -- | $93,654 | $14,000 | $79,654 |
Source: Public Records
Map
Nearby Homes
- 159 Misty Way
- LOT 6 Sky Country Rd
- 149 Highland Rd S
- 77 Old River Rd
- 97 Beaumont Dr
- 65 Golden Autumn Dr
- 238 Grand View St
- 502 Wimpy Mill Rd
- 94 Mountain View Dr
- 10 Rustin Ridge
- 2589 Morrison Moore Pkwy E
- 85 Summit Canyon Rd Unit H102
- 00 Cavender Creek Rd
- 119 Boyd Cir Unit D
- 95 Jones St
- 122 Tritt Rd
- 399 N Chestatee St
- 4039 Highway 19 N
- 0 S Chestatee St Unit 10619536
- 6480A Highway 52
- 513 Sky Country Rd
- 99 Hyalite Rd W
- 132 Misty Way
- 89 Misty Way
- 112 Misty Way Unit DR
- 112 Misty Way Unit DRIVE
- 90 Misty Way
- 455 Sky Country Rd
- 92 Misty Way
- Lot137 Misty Way
- Lot136 Misty Way
- 258 & 270 Misty Way
- W Misty Way Unit 134
- 74 Misty Way
- 260 Misty Way
- 43 Hyalite Rd W
- 43 Hyalite Rd W Unit 9
- 137 Misty Way
- 232 Hyalite Rd W
- 100 Hyalite Rd W