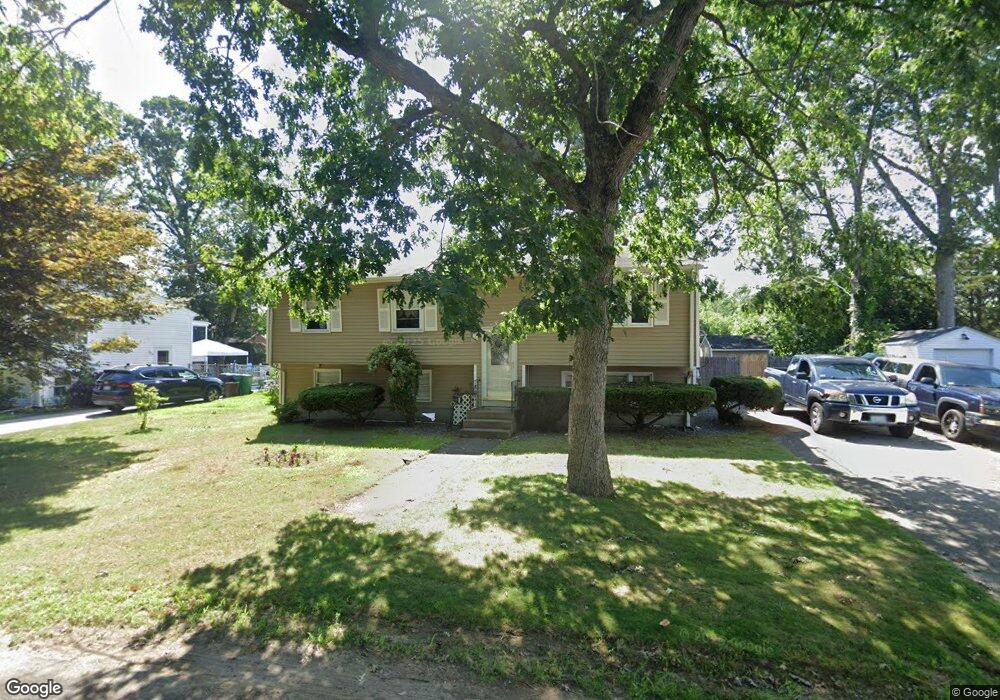
71 Model Ave Warwick, RI 02889
Hoxie NeighborhoodEstimated Value: $356,000 - $418,124
4
Beds
1
Bath
1,623
Sq Ft
$240/Sq Ft
Est. Value
About This Home
This home is located at 71 Model Ave, Warwick, RI 02889 and is currently estimated at $389,531, approximately $240 per square foot. 71 Model Ave is a home located in Kent County with nearby schools including Saint Kevin School and Bishop Hendricken High School.
Ownership History
Date
Name
Owned For
Owner Type
Purchase Details
Closed on
Apr 29, 2004
Sold by
Noverca Russell A
Bought by
Urban James R
Current Estimated Value
Home Financials for this Owner
Home Financials are based on the most recent Mortgage that was taken out on this home.
Original Mortgage
$491,200
Outstanding Balance
$224,570
Interest Rate
5.36%
Mortgage Type
Purchase Money Mortgage
Estimated Equity
$164,961
Purchase Details
Closed on
Apr 14, 2004
Sold by
Oliver Beverly D
Bought by
Bronswood Melony M
Home Financials for this Owner
Home Financials are based on the most recent Mortgage that was taken out on this home.
Original Mortgage
$491,200
Outstanding Balance
$224,570
Interest Rate
5.36%
Mortgage Type
Purchase Money Mortgage
Estimated Equity
$164,961
Create a Home Valuation Report for This Property
The Home Valuation Report is an in-depth analysis detailing your home's value as well as a comparison with similar homes in the area
Home Values in the Area
Average Home Value in this Area
Purchase History
| Date | Buyer | Sale Price | Title Company |
|---|---|---|---|
| Urban James R | $614,000 | -- | |
| Bronswood Melony M | $160,000 | -- |
Source: Public Records
Mortgage History
| Date | Status | Borrower | Loan Amount |
|---|---|---|---|
| Open | Bronswood Melony M | $110,000 | |
| Closed | Bronswood Melony M | $108,555 | |
| Open | Bronswood Melony M | $491,200 | |
| Closed | Bronswood Melony M | $120,000 |
Source: Public Records
Tax History
| Year | Tax Paid | Tax Assessment Tax Assessment Total Assessment is a certain percentage of the fair market value that is determined by local assessors to be the total taxable value of land and additions on the property. | Land | Improvement |
|---|---|---|---|---|
| 2025 | $4,465 | $351,600 | $106,200 | $245,400 |
| 2024 | $4,014 | $277,400 | $87,700 | $189,700 |
| 2023 | $3,936 | $277,400 | $87,700 | $189,700 |
| 2022 | $3,830 | $204,500 | $61,600 | $142,900 |
| 2021 | $3,830 | $204,500 | $61,600 | $142,900 |
| 2020 | $3,830 | $204,500 | $61,600 | $142,900 |
| 2019 | $3,830 | $204,500 | $61,600 | $142,900 |
| 2018 | $3,343 | $160,700 | $55,100 | $105,600 |
| 2017 | $3,253 | $160,700 | $55,100 | $105,600 |
| 2016 | $3,253 | $160,700 | $55,100 | $105,600 |
| 2015 | $3,156 | $152,100 | $57,500 | $94,600 |
| 2014 | $3,051 | $152,100 | $57,500 | $94,600 |
| 2013 | $3,010 | $152,100 | $57,500 | $94,600 |
Source: Public Records
Map
Nearby Homes
Your Personal Tour Guide
Ask me questions while you tour the home.