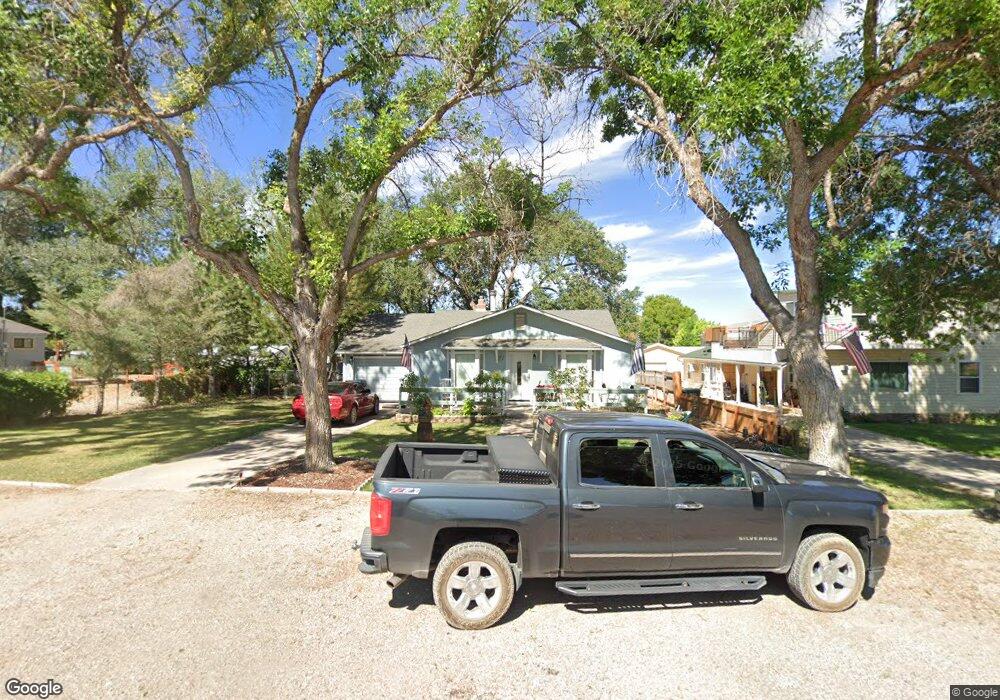
71 N 200 W Paragonah, UT 84760
Estimated Value: $262,000 - $335,000
2
Beds
1
Bath
998
Sq Ft
$299/Sq Ft
Est. Value
About This Home
This home is located at 71 N 200 W, Paragonah, UT 84760 and is currently estimated at $298,660, approximately $299 per square foot. 71 N 200 W is a home located in Iron County with nearby schools including Parowan School, Parowan High School, and Cedar City High School.
Ownership History
Date
Name
Owned For
Owner Type
Purchase Details
Closed on
Aug 19, 2021
Sold by
H Gene Perry Living Trust
Bought by
Hopkin Timothy and Hopkin Lynne K
Current Estimated Value
Home Financials for this Owner
Home Financials are based on the most recent Mortgage that was taken out on this home.
Original Mortgage
$289,656
Outstanding Balance
$263,387
Interest Rate
2.9%
Mortgage Type
FHA
Estimated Equity
$35,273
Purchase Details
Closed on
Aug 18, 2006
Sold by
Harris Charles D and Harris Dianna S
Bought by
Perry Harold Gene and Perry Nona Louise
Create a Home Valuation Report for This Property
The Home Valuation Report is an in-depth analysis detailing your home's value as well as a comparison with similar homes in the area
Home Values in the Area
Average Home Value in this Area
Purchase History
| Date | Buyer | Sale Price | Title Company |
|---|---|---|---|
| Hopkin Timothy | -- | Southern Utah Title | |
| Perry Harold Gene | -- | -- |
Source: Public Records
Mortgage History
| Date | Status | Borrower | Loan Amount |
|---|---|---|---|
| Open | Hopkin Timothy | $289,656 |
Source: Public Records
Tax History Compared to Growth
Tax History
| Year | Tax Paid | Tax Assessment Tax Assessment Total Assessment is a certain percentage of the fair market value that is determined by local assessors to be the total taxable value of land and additions on the property. | Land | Improvement |
|---|---|---|---|---|
| 2025 | $944 | $117,107 | $44,838 | $72,269 |
| 2023 | $867 | $98,810 | $40,035 | $58,775 |
| 2022 | $781 | $81,610 | $36,395 | $45,215 |
| 2021 | $651 | $67,980 | $22,745 | $45,235 |
| 2020 | $684 | $63,110 | $17,850 | $45,260 |
| 2019 | $688 | $60,560 | $17,850 | $42,710 |
| 2018 | $676 | $58,230 | $15,520 | $42,710 |
| 2017 | $627 | $52,690 | $15,520 | $37,170 |
| 2016 | $633 | $50,420 | $15,520 | $34,900 |
| 2015 | $630 | $47,345 | $0 | $0 |
| 2014 | $659 | $47,245 | $0 | $0 |
Source: Public Records
Map
Nearby Homes