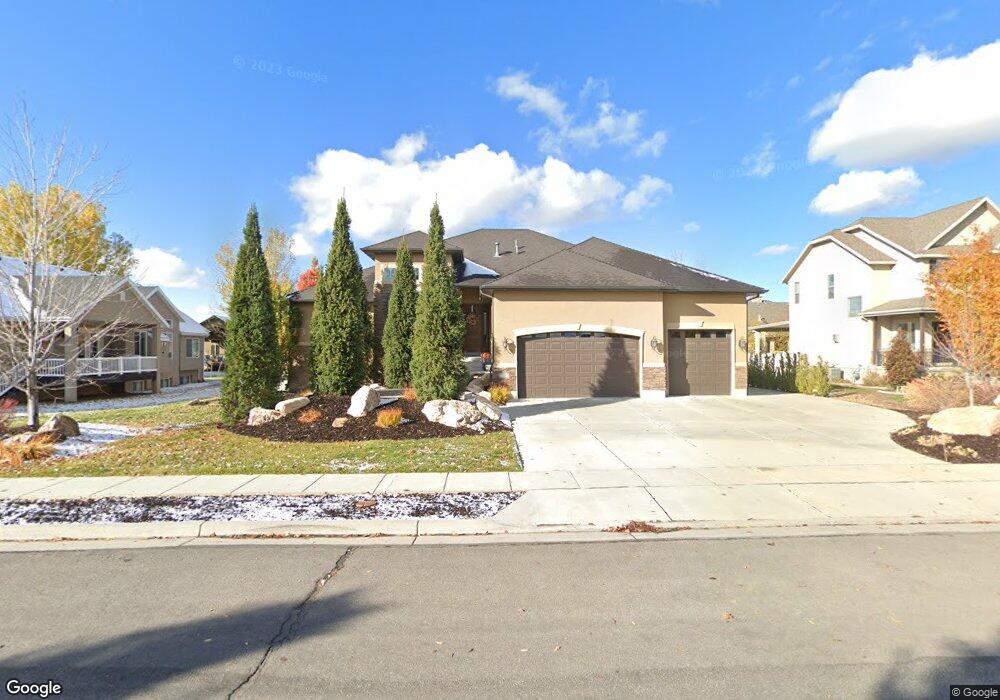
71 N 3225 W Unit 125 Layton, UT 84041
Estimated Value: $870,000 - $919,000
3
Beds
4
Baths
4,000
Sq Ft
$225/Sq Ft
Est. Value
About This Home
This home is located at 71 N 3225 W Unit 125, Layton, UT 84041 and is currently estimated at $898,967, approximately $224 per square foot. 71 N 3225 W Unit 125 is a home located in Davis County with nearby schools including Sand Springs Elementary School, Legacy Junior High School, and Layton High School.
Ownership History
Date
Name
Owned For
Owner Type
Purchase Details
Closed on
Sep 25, 2020
Sold by
Carino Francis I and Carino Vina G
Bought by
Kemp Tawnia and Kemp Kory
Current Estimated Value
Home Financials for this Owner
Home Financials are based on the most recent Mortgage that was taken out on this home.
Original Mortgage
$496,400
Outstanding Balance
$440,522
Interest Rate
2.9%
Mortgage Type
New Conventional
Estimated Equity
$458,445
Purchase Details
Closed on
Jan 17, 2013
Sold by
Forest Creek Construction Llc
Bought by
Carino Francis I and Carino Vina G
Home Financials for this Owner
Home Financials are based on the most recent Mortgage that was taken out on this home.
Original Mortgage
$417,000
Interest Rate
3.31%
Mortgage Type
VA
Purchase Details
Closed on
Jul 5, 2012
Sold by
Perpetual Development Company Inc
Bought by
Forest Creek Construction Llc
Home Financials for this Owner
Home Financials are based on the most recent Mortgage that was taken out on this home.
Original Mortgage
$320,000
Interest Rate
3.74%
Mortgage Type
Future Advance Clause Open End Mortgage
Purchase Details
Closed on
May 16, 2006
Sold by
Smith Stuart A
Bought by
Perpetual Development Co Inc
Create a Home Valuation Report for This Property
The Home Valuation Report is an in-depth analysis detailing your home's value as well as a comparison with similar homes in the area
Home Values in the Area
Average Home Value in this Area
Purchase History
| Date | Buyer | Sale Price | Title Company |
|---|---|---|---|
| Kemp Tawnia | -- | Old Republic National Title | |
| Carino Francis I | -- | Mountain View Title & Escrow | |
| Forest Creek Construction Llc | -- | Bonneville Superior | |
| Perpetual Development Co Inc | -- | Bonneville Title Company |
Source: Public Records
Mortgage History
| Date | Status | Borrower | Loan Amount |
|---|---|---|---|
| Open | Kemp Tawnia | $496,400 | |
| Previous Owner | Carino Francis I | $417,000 | |
| Previous Owner | Forest Creek Construction Llc | $320,000 |
Source: Public Records
Tax History Compared to Growth
Tax History
| Year | Tax Paid | Tax Assessment Tax Assessment Total Assessment is a certain percentage of the fair market value that is determined by local assessors to be the total taxable value of land and additions on the property. | Land | Improvement |
|---|---|---|---|---|
| 2025 | $4,690 | $492,250 | $126,202 | $366,048 |
| 2024 | $4,447 | $470,250 | $136,260 | $333,990 |
| 2023 | $4,314 | $804,000 | $141,605 | $662,395 |
| 2022 | $4,776 | $483,450 | $83,995 | $399,455 |
| 2021 | $4,260 | $643,000 | $125,987 | $517,013 |
| 2020 | $1,744 | $549,000 | $107,199 | $441,801 |
| 2019 | $1,756 | $540,000 | $107,080 | $432,920 |
| 2018 | $1,587 | $510,000 | $94,237 | $415,763 |
| 2016 | $1,412 | $255,695 | $38,515 | $217,180 |
| 2015 | $3,091 | $215,545 | $38,515 | $177,030 |
| 2014 | $681 | $197,463 | $38,515 | $158,948 |
| 2013 | -- | $172,076 | $39,709 | $132,367 |
Source: Public Records
Map
Nearby Homes
- 245 S Summer Breeze Ln
- 101 S 3600 W
- 3535 W Overlook Dr
- 3583 W 200 S
- 454 N 3550 W
- 2794 W Gentile St
- 567 W 3575 S
- 697 N 3275 W
- 3169 S 550 W
- 3263 W 850 N
- 2875 N Hill Rd Unit 199
- 2875 N Hill Rd Unit 27
- 306 S Sunburst Dr
- 2674 S 75 E
- 818 N 2625 W
- 967 W Yamada Ct
- 2681 S 200 E
- 3391 W 1125 N
- 162 E 2600 S
- 2184 W Gentile St
- 71 N 3225 W
- 87 N 3225 W
- 3254 W 25 N
- 3254 W 25 N Unit 126
- 70 N 3300 W
- 48 N 3300 W
- 92 N 3300 W
- 92 N 3300 W Unit 129
- 64 N 3225 W
- 109 N 3225 W Unit 123
- 109 N 3225 W
- 84 N 3225 W
- 84 N 3225 W Unit 107
- 46 N 3225 W Unit 105
- 104 N 3225 W
- 104 N 3225 W Unit 108
- 114 N 3300 W Unit 130
- 3279 W 25 N
- 3241 W 25 N Unit 103
- 3261 W 25 N