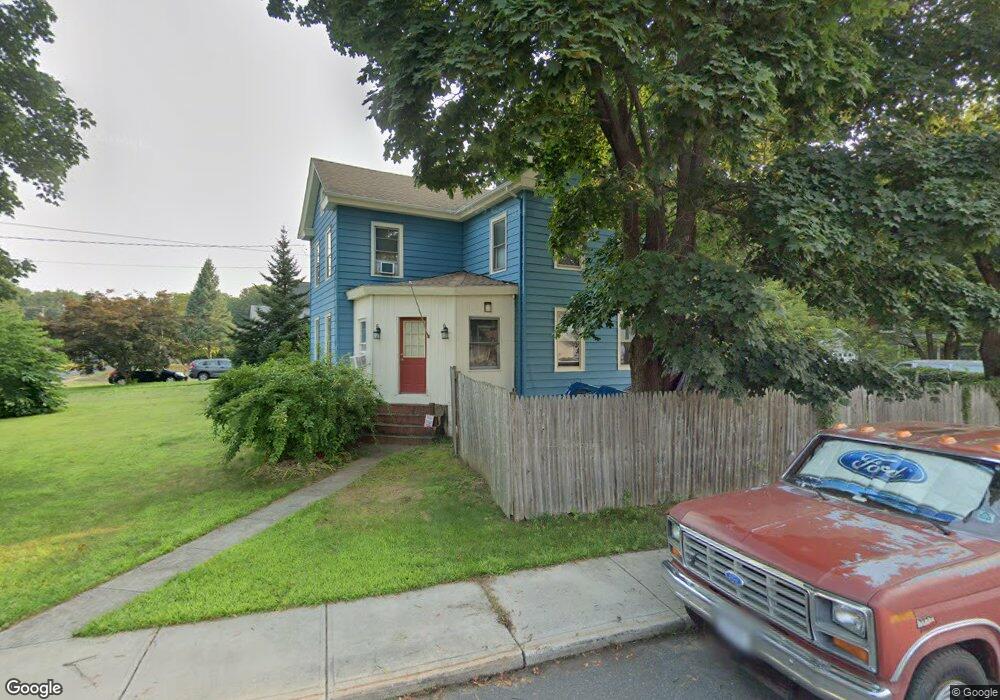
71 N Main St Windsor Locks, CT 06096
Estimated Value: $341,000 - $407,000
3
Beds
3
Baths
1,942
Sq Ft
$186/Sq Ft
Est. Value
About This Home
This home is located at 71 N Main St, Windsor Locks, CT 06096 and is currently estimated at $361,180, approximately $185 per square foot. 71 N Main St is a home located in Hartford County with nearby schools including North Street School, South Elementary School, and Windsor Locks Middle School.
Ownership History
Date
Name
Owned For
Owner Type
Purchase Details
Closed on
Jan 2, 2008
Sold by
Richardson Samuel and Richardson Amy
Bought by
Warren Andrew and Warren Anna
Current Estimated Value
Home Financials for this Owner
Home Financials are based on the most recent Mortgage that was taken out on this home.
Original Mortgage
$206,458
Outstanding Balance
$130,477
Interest Rate
6.27%
Estimated Equity
$230,703
Purchase Details
Closed on
Sep 17, 2001
Sold by
Juttner Donna
Bought by
Richardson Samuel
Purchase Details
Closed on
May 14, 1998
Sold by
Lataille Frederick and Dangona Dunielle
Bought by
Dunne Donna
Purchase Details
Closed on
Aug 25, 1992
Sold by
Sb Dime and Sb Ny
Bought by
Daugona Frederick and Daugona Danielli
Create a Home Valuation Report for This Property
The Home Valuation Report is an in-depth analysis detailing your home's value as well as a comparison with similar homes in the area
Home Values in the Area
Average Home Value in this Area
Purchase History
| Date | Buyer | Sale Price | Title Company |
|---|---|---|---|
| Warren Andrew | $179,900 | -- | |
| Richardson Samuel | $134,900 | -- | |
| Dunne Donna | $117,500 | -- | |
| Daugona Frederick | $101,500 | -- |
Source: Public Records
Mortgage History
| Date | Status | Borrower | Loan Amount |
|---|---|---|---|
| Open | Daugona Frederick | $206,458 | |
| Previous Owner | Daugona Frederick | $128,690 | |
| Previous Owner | Daugona Frederick | $131,000 |
Source: Public Records
Tax History
| Year | Tax Paid | Tax Assessment Tax Assessment Total Assessment is a certain percentage of the fair market value that is determined by local assessors to be the total taxable value of land and additions on the property. | Land | Improvement |
|---|---|---|---|---|
| 2025 | $4,373 | $182,280 | $49,140 | $133,140 |
| 2024 | $3,102 | $110,250 | $34,930 | $75,320 |
| 2023 | $2,903 | $110,250 | $34,930 | $75,320 |
| 2022 | $2,848 | $110,250 | $34,930 | $75,320 |
| 2021 | $2,848 | $110,250 | $34,930 | $75,320 |
| 2020 | $2,848 | $110,250 | $34,930 | $75,320 |
| 2019 | $2,848 | $110,250 | $34,930 | $75,320 |
| 2017 | $2,858 | $107,200 | $33,000 | $74,200 |
| 2016 | $2,885 | $108,200 | $33,000 | $75,200 |
| 2015 | $2,899 | $108,200 | $33,000 | $75,200 |
| 2014 | $3,287 | $125,300 | $37,500 | $87,800 |
Source: Public Records
Map
Nearby Homes
- 15 Suffield St
- 0 N Water St Unit 24138494
- 0 N Water St Unit 24128295
- 0 N Water St Unit 24128294
- 0 N Water St Unit 24128288
- 0 N Water St
- 13 Quail Ct
- 80 West St
- 202 Reed Ave
- 4 Pleasant St
- 19 Dean Ave
- 59 Elm St
- 29 Dean Ave
- 32 Pleasant Rd
- 13 Jubrey Ln
- 143 Bridge St
- 102 Orchard Hill Dr
- 140 S Water St
- 660 East St S
- 687 East St S
Your Personal Tour Guide
Ask me questions while you tour the home.