
Landlord's Agent in 2019
Dean Papadopoulos
Realty ONE Group Connect
(203) 980-2509
4 in this area
28 Total Sales
Estimated Value: $369,000
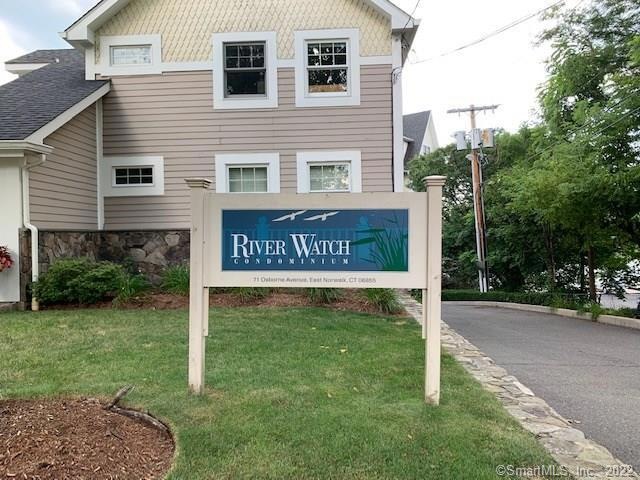
THIS UNIT HAS IT ALL! Welcome to the River Watch Condominium Complex in the popular East Norwalk. This second floor space has it's own separate entrance, is up do date, and will make every tenant feel right at home. Many windows in each room bringing in tons of natural light! Bring your king sized bed! The bedroom is truly a master bed in which it includes vaulted ceilings, updated/clean full bathroom with tons of closet space and MORE! Washer/Dryer in unit for your convenience. Open and updated kitchen with granite countertops and stainless steel appliances. Kitchen leads to breakfast bar, dining room area or spacious deck. Your choice! Living room open to kitchen and allows for a complete sitting setting. Complex allows electric grills on deck - no propane gas. Central air for cooling and natural gas for heat/hot water keep utilities LOW. Hardwood floors throughout. Assigned garage parking and fenced storage space in the lower level. Visitor parking available in lot. Street parking also allowed. (2) balconies on each end of this unit one in which has WATER VIEWS of the Norwalk River. Landlord has painted within the last 3 months and will be sure to have unit thoroughly cleaned prior to tenant move-in. Conveniently located within walking distance to East Norwalk Train Station and minutes from, I95 (Exit 16), SONO, Norwalk River Trail, Calf Pasture Beach, Veterans Park and MORE! **OPTIONS TO LEASE FURNISHED**
Last Agent to Rent the Property
Realty ONE Group Connect License #RES.0798068 Listed on: 07/25/2019
Last Renter's Agent
Linnea McManus
Coldwell Banker Realty License #RES.0769297
| Date | Buyer | Sale Price | Title Company |
|---|---|---|---|
| Bank New York Mellon | -- | -- | |
| Barnett Roslyn | -- | -- |
| Date | Event | Price | List to Sale | Price per Sq Ft | Prior Sale |
|---|---|---|---|---|---|
| 10/19/2019 10/19/19 | Rented | $1,900 | 0.0% | -- | |
| 10/19/2019 10/19/19 | Under Contract | -- | -- | -- | |
| 10/03/2019 10/03/19 | Price Changed | $1,900 | -5.0% | $3 / Sq Ft | |
| 09/03/2019 09/03/19 | Price Changed | $2,000 | -4.8% | $3 / Sq Ft | |
| 08/09/2019 08/09/19 | Price Changed | $2,100 | -2.3% | $3 / Sq Ft | |
| 07/25/2019 07/25/19 | For Rent | $2,150 | 0.0% | -- | |
| 03/15/2018 03/15/18 | Sold | $223,000 | -2.6% | $317 / Sq Ft | View Prior Sale |
| 01/24/2018 01/24/18 | For Sale | $229,000 | 0.0% | $325 / Sq Ft | |
| 10/19/2016 10/19/16 | Rented | $1,900 | 0.0% | -- | |
| 09/19/2016 09/19/16 | Under Contract | -- | -- | -- | |
| 09/18/2016 09/18/16 | For Rent | $1,900 | +0.5% | -- | |
| 05/05/2015 05/05/15 | Rented | $1,890 | 0.0% | -- | |
| 04/05/2015 04/05/15 | Under Contract | -- | -- | -- | |
| 01/28/2015 01/28/15 | For Rent | $1,890 | +2.2% | -- | |
| 12/03/2012 12/03/12 | Rented | $1,850 | -1.3% | -- | |
| 12/03/2012 12/03/12 | For Rent | $1,875 | -- | -- |
| Year | Tax Paid | Tax Assessment Tax Assessment Total Assessment is a certain percentage of the fair market value that is determined by local assessors to be the total taxable value of land and additions on the property. | Land | Improvement |
|---|---|---|---|---|
| 2021 | $3,975 | $165,870 | $0 | $165,870 |
Landlord's Agent in 2019
Dean Papadopoulos
Realty ONE Group Connect
(203) 980-2509
4 in this area
28 Total Sales
L
Tenant's Agent in 2019
Linnea McManus
Coldwell Banker Realty
Seller's Agent in 2018
Victor Bolanos
Bolanos & Associates LLC
(203) 604-6773
1 in this area
92 Total Sales
W
Seller's Agent in 2016
Wandra Haywood
Higgins Group Real Estate
Buyer's Agent in 2016
Monica Osorio
Realty ONE Group Connect
(203) 943-8831
2 in this area
50 Total Sales
Buyer's Agent in 2012
Xanthoula Ananiadis
Coldwell Banker Realty
(203) 524-1825
2 in this area
61 Total Sales
Source: SmartMLS
MLS Number: 170219859
APN: NORW M:3 B:7 L:26-C2
Disclaimer: Certain information contained herein is derived from information provided by parties other than Homes.com. All information provided is deemed reliable, but is not guaranteed to be accurate and should be independently verified.
![]() IDX information is provided exclusively for personal, non-commercial use, and may not be used for any purpose other than to identify prospective properties consumers may be interested in purchasing. Information is deemed reliable but not guaranteed.
IDX information is provided exclusively for personal, non-commercial use, and may not be used for any purpose other than to identify prospective properties consumers may be interested in purchasing. Information is deemed reliable but not guaranteed.