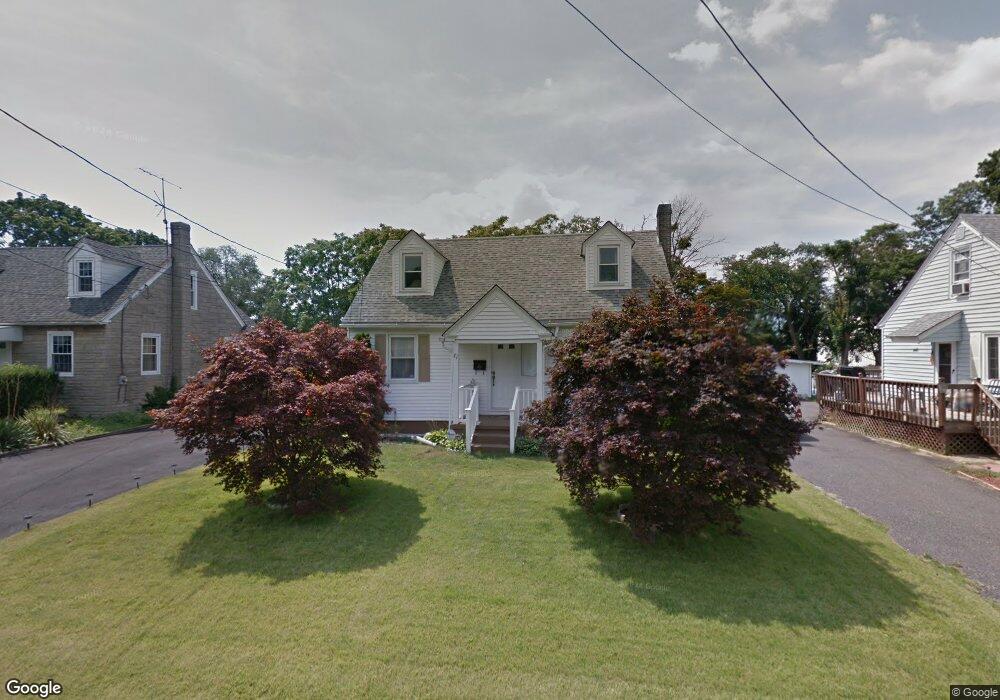
71 Osborne Ave Vineland, NJ 08360
Estimated Value: $239,000 - $310,000
--
Bed
--
Bath
1,356
Sq Ft
$203/Sq Ft
Est. Value
About This Home
This home is located at 71 Osborne Ave, Vineland, NJ 08360 and is currently estimated at $275,600, approximately $203 per square foot. 71 Osborne Ave is a home located in Cumberland County with nearby schools including Max Leuchter Elementary School, T.W. Wallace Middle School, and Vineland Senior High School.
Ownership History
Date
Name
Owned For
Owner Type
Purchase Details
Closed on
Aug 19, 2017
Sold by
Gualan Poma Jorge and Gualan Jorge
Bought by
Gualan Poma Jorge H and Alvear Suarez Elsa G
Current Estimated Value
Purchase Details
Closed on
Apr 5, 2007
Sold by
Horner John M
Bought by
Alvear Gualan Jorge and Alvear Gualan Elsa
Purchase Details
Closed on
Dec 28, 2004
Sold by
Santiago Edras
Bought by
Horner John M
Home Financials for this Owner
Home Financials are based on the most recent Mortgage that was taken out on this home.
Original Mortgage
$126,000
Interest Rate
5.64%
Create a Home Valuation Report for This Property
The Home Valuation Report is an in-depth analysis detailing your home's value as well as a comparison with similar homes in the area
Home Values in the Area
Average Home Value in this Area
Purchase History
| Date | Buyer | Sale Price | Title Company |
|---|---|---|---|
| Gualan Poma Jorge H | -- | None Available | |
| Alvear Gualan Jorge | $169,000 | -- | |
| Horner John M | $126,000 | -- |
Source: Public Records
Mortgage History
| Date | Status | Borrower | Loan Amount |
|---|---|---|---|
| Previous Owner | Horner John M | $126,000 |
Source: Public Records
Tax History Compared to Growth
Tax History
| Year | Tax Paid | Tax Assessment Tax Assessment Total Assessment is a certain percentage of the fair market value that is determined by local assessors to be the total taxable value of land and additions on the property. | Land | Improvement |
|---|---|---|---|---|
| 2025 | $3,945 | $123,900 | $26,200 | $97,700 |
| 2024 | $3,945 | $123,900 | $26,200 | $97,700 |
| 2023 | $3,919 | $123,900 | $26,200 | $97,700 |
| 2022 | $3,802 | $123,900 | $26,200 | $97,700 |
| 2021 | $3,550 | $123,900 | $26,200 | $97,700 |
| 2020 | $3,627 | $123,900 | $26,200 | $97,700 |
| 2019 | $3,577 | $123,900 | $26,200 | $97,700 |
| 2018 | $3,483 | $123,900 | $26,200 | $97,700 |
| 2017 | $3,308 | $123,900 | $26,200 | $97,700 |
| 2016 | $3,192 | $123,900 | $26,200 | $97,700 |
| 2015 | $3,074 | $123,900 | $26,200 | $97,700 |
| 2014 | $2,907 | $123,900 | $26,200 | $97,700 |
Source: Public Records
Map
Nearby Homes
- 108 W Park Ave
- 550 Northwest Ave
- 0 W Landis Ave
- 515 Edward Ln
- 218 W Montrose St
- 404 Montrose St
- 663 Wayne Ave
- 400 N 7th St
- 636 E Pear St
- 511 E Grape St
- 1252 W Oak Rd
- 1489 N Delsea Dr
- 1500 Venus Dr
- 1429 W Oak Rd
- 1457 W Landis Ave
- 818 E Pear St
- 406 S 6th St
- 1535 W Landis Ave
- 724 E Grape St
- 708 E Montrose St Unit 710