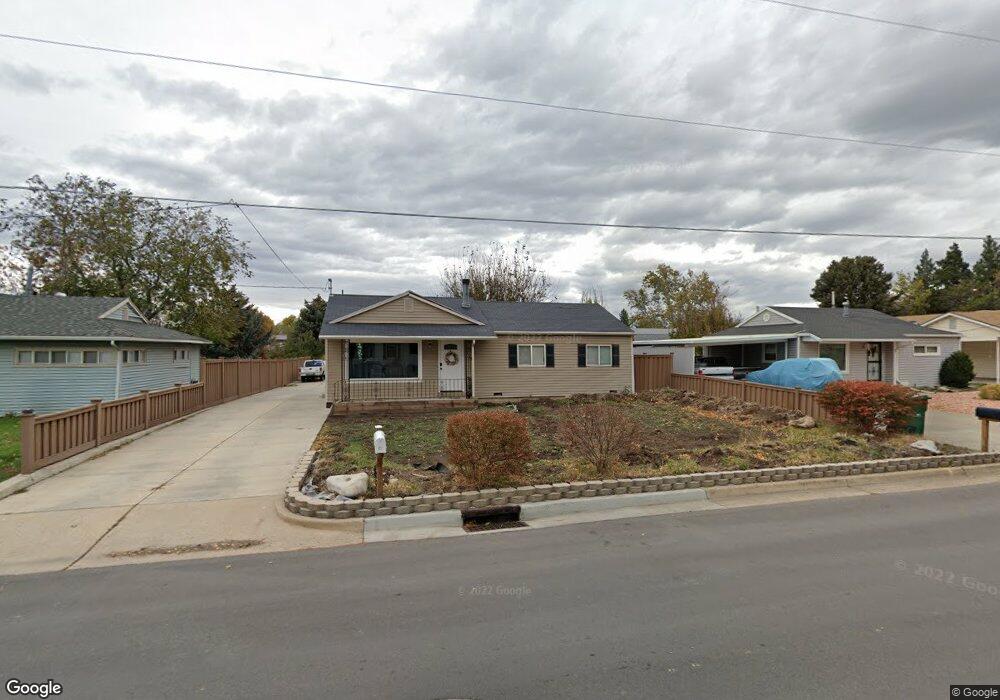
71 Phillips St Layton, UT 84041
Estimated Value: $401,000 - $494,000
3
Beds
2
Baths
1,100
Sq Ft
$397/Sq Ft
Est. Value
About This Home
This home is located at 71 Phillips St, Layton, UT 84041 and is currently estimated at $436,992, approximately $397 per square foot. 71 Phillips St is a home located in Davis County with nearby schools including Kay's Creek Elementary School, Shoreline Junior High School, and Davis High School.
Ownership History
Date
Name
Owned For
Owner Type
Purchase Details
Closed on
May 3, 2024
Sold by
Cline Morgan and Clark Tanner
Bought by
Clark Tanner and Clark Morgan
Current Estimated Value
Home Financials for this Owner
Home Financials are based on the most recent Mortgage that was taken out on this home.
Original Mortgage
$100,000
Outstanding Balance
$98,386
Interest Rate
6.79%
Mortgage Type
Credit Line Revolving
Estimated Equity
$338,606
Purchase Details
Closed on
Sep 4, 2018
Sold by
Moon Heather Marie
Bought by
Clark Tanner and Cline Morgan
Home Financials for this Owner
Home Financials are based on the most recent Mortgage that was taken out on this home.
Original Mortgage
$239,580
Interest Rate
4.5%
Mortgage Type
FHA
Purchase Details
Closed on
May 25, 2018
Sold by
Johnson Christopher L and Craig Kelli S
Bought by
Moon Heather Marie
Home Financials for this Owner
Home Financials are based on the most recent Mortgage that was taken out on this home.
Original Mortgage
$160,000
Interest Rate
4.4%
Mortgage Type
New Conventional
Purchase Details
Closed on
Dec 9, 2010
Sold by
Johnson Christopher L and Craig Kelli S
Bought by
Johnson Christopher L and Craig Kelli S
Home Financials for this Owner
Home Financials are based on the most recent Mortgage that was taken out on this home.
Original Mortgage
$131,500
Interest Rate
4.18%
Mortgage Type
New Conventional
Purchase Details
Closed on
Mar 21, 2007
Sold by
Russell Josh Blaine and Russell Danielle Marie
Bought by
Johnson Christopher L and Craig Kelli S
Home Financials for this Owner
Home Financials are based on the most recent Mortgage that was taken out on this home.
Original Mortgage
$135,850
Interest Rate
6.2%
Mortgage Type
Purchase Money Mortgage
Purchase Details
Closed on
Jun 1, 2004
Sold by
Rigby Tyson G
Bought by
Russell Josh Blaine and Russell Danielle Marie
Purchase Details
Closed on
Jul 17, 2003
Sold by
Sapp Deidre S
Bought by
Rigby Tyson G
Purchase Details
Closed on
Feb 4, 2002
Sold by
Salomon Brothers Realty Corp
Bought by
Rigby Tyson G and Sapp Deidre S
Home Financials for this Owner
Home Financials are based on the most recent Mortgage that was taken out on this home.
Original Mortgage
$86,330
Interest Rate
6.8%
Purchase Details
Closed on
Sep 7, 2001
Sold by
Lloyd Kelly R and Lloyd Carol A
Bought by
Salomon Brothers Realty Corp
Create a Home Valuation Report for This Property
The Home Valuation Report is an in-depth analysis detailing your home's value as well as a comparison with similar homes in the area
Home Values in the Area
Average Home Value in this Area
Purchase History
| Date | Buyer | Sale Price | Title Company |
|---|---|---|---|
| Clark Tanner | -- | First American Title Insurance | |
| Clark Tanner | -- | Metro National Title | |
| Moon Heather Marie | -- | Metro National Title | |
| Johnson Christopher L | -- | Cornerstone Title Ins A | |
| Johnson Christopher L | -- | Hickman Land Title Co | |
| Russell Josh Blaine | -- | Bonneville Title Company Inc | |
| Rigby Tyson G | -- | -- | |
| Rigby Tyson G | -- | Security Title Agency | |
| Salomon Brothers Realty Corp | $76,381 | Backman Stewart Title Servic |
Source: Public Records
Mortgage History
| Date | Status | Borrower | Loan Amount |
|---|---|---|---|
| Open | Clark Tanner | $100,000 | |
| Previous Owner | Clark Tanner | $239,580 | |
| Previous Owner | Clark Tanner | $14,080 | |
| Previous Owner | Moon Heather Marie | $160,000 | |
| Previous Owner | Johnson Christopher L | $131,500 | |
| Previous Owner | Johnson Christopher L | $135,850 | |
| Previous Owner | Rigby Tyson G | $86,330 |
Source: Public Records
Tax History
| Year | Tax Paid | Tax Assessment Tax Assessment Total Assessment is a certain percentage of the fair market value that is determined by local assessors to be the total taxable value of land and additions on the property. | Land | Improvement |
|---|---|---|---|---|
| 2025 | $2,101 | $220,550 | $112,890 | $107,660 |
| 2024 | $2,034 | $215,050 | $124,463 | $90,587 |
| 2023 | $1,894 | $353,000 | $123,987 | $229,013 |
| 2022 | $2,038 | $206,250 | $76,979 | $129,271 |
| 2021 | $1,848 | $279,000 | $115,491 | $163,509 |
| 2020 | $1,637 | $237,000 | $97,292 | $139,708 |
| 2019 | $1,452 | $206,000 | $99,635 | $106,365 |
| 2018 | $1,173 | $167,000 | $87,409 | $79,591 |
| 2016 | $1,021 | $74,965 | $34,436 | $40,529 |
| 2015 | $1,002 | $69,850 | $34,436 | $35,414 |
| 2014 | $1,068 | $76,130 | $34,436 | $41,694 |
| 2013 | -- | $76,144 | $18,612 | $57,532 |
Source: Public Records
Map
Nearby Homes
- 80 E 850 S
- 799 S 125 E
- 949 S 225 E
- 948 S 250 E
- 282 E 925 S
- 1460 W Pleasant View Dr Unit 7
- 1435 W Pleasant View Dr Unit 37
- 1439 W Pleasant View Dr Unit 35
- 1440 W Pleasant View Dr Unit 3
- 753 S 300 E
- 811 S Main St
- 706 S 600 E
- 623 E Clearwater Dr Unit 15
- 389 Morgan St
- 905 S Main St Unit G
- 917 S Main St Unit H
- 895 S Main St Unit E
- 680 N Main St Unit B13
- 680 N Main St Unit D14
- 186 N Mountain Vistas Rd
Your Personal Tour Guide
Ask me questions while you tour the home.