71 Powers St Needham, MA 02492
Needham AreaEstimated Value: $1,627,000 - $2,255,000
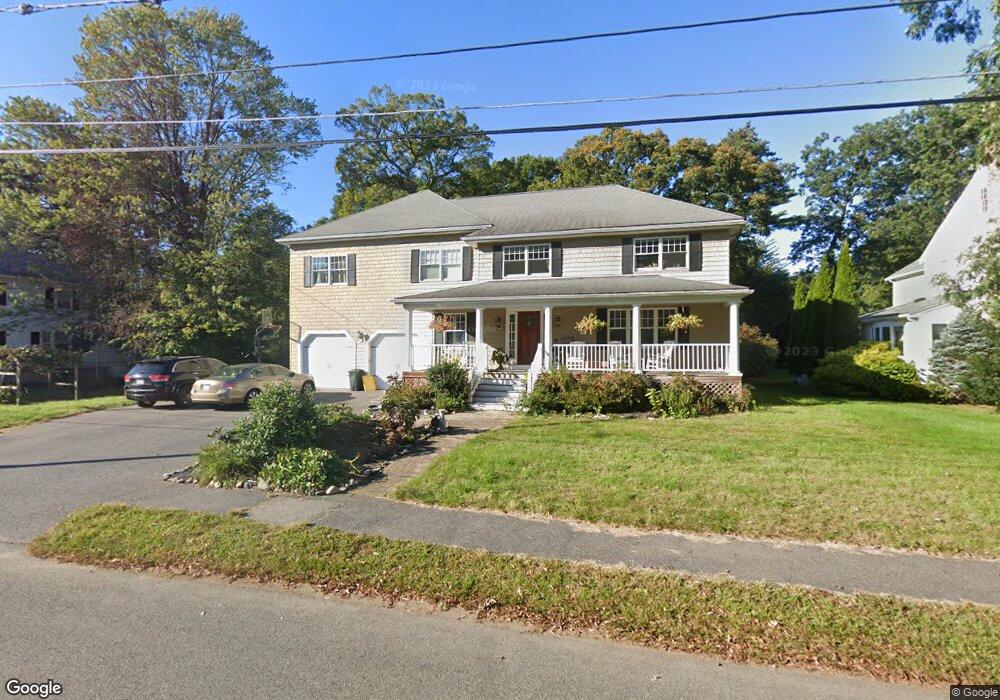
About This Home
This home is located at 71 Powers St, Needham, MA 02492 and is currently estimated at $1,935,468, approximately $1,129 per square foot. 71 Powers St is a home located in Norfolk County with nearby schools including Mitchell Elementary School, High Rock Middle School, and Pollard Middle School.
Ownership History
We collect this data history from publicly available records. To have your information removed, we recommend requesting removal directly through your county’s website.
Purchase Details
Home Values in the Area
Average Home Value in this Area
Purchase History
We collect this data history from publicly available records. To have your information removed, we recommend requesting removal directly through your county’s website.
| Date | Buyer | Sale Price | Title Company |
|---|---|---|---|
| $285,000 | -- |
Mortgage History
We collect this data history from publicly available records. To have your information removed, we recommend requesting removal directly through your county’s website.
| Date | Status | Borrower | Loan Amount |
|---|---|---|---|
| Open | $600,000 | ||
| Closed | $249,000 | ||
| Closed | $240,000 | ||
| Closed | $74,000 | ||
| Closed | $300,000 |
Tax History
We collect this data history from publicly available records. To have your information removed, we recommend requesting removal directly through your county’s website.
| Year | Tax Paid | Tax Assessment Tax Assessment Total Assessment is a certain percentage of the fair market value that is determined by local assessors to be the total taxable value of land and additions on the property. | Land | Improvement |
|---|---|---|---|---|
| 2025 | $17,317 | $1,633,700 | $814,800 | $818,900 |
| 2024 | $19,530 | $1,559,900 | $591,400 | $968,500 |
| 2023 | $19,427 | $1,489,800 | $591,400 | $898,400 |
| 2022 | $18,758 | $1,403,000 | $548,400 | $854,600 |
| 2021 | $18,281 | $1,403,000 | $548,400 | $854,600 |
| 2020 | $17,741 | $1,420,400 | $548,400 | $872,000 |
| 2019 | $16,770 | $1,353,500 | $499,500 | $854,000 |
| 2018 | $16,080 | $1,353,500 | $499,500 | $854,000 |
| 2017 | $14,920 | $1,254,800 | $499,500 | $755,300 |
| 2016 | $14,480 | $1,254,800 | $499,500 | $755,300 |
| 2015 | $14,167 | $1,254,800 | $499,500 | $755,300 |
| 2014 | $13,582 | $1,166,800 | $435,700 | $731,100 |
Map
- 89 Melrose Ave
- 246 Manning St
- 9 Morley St
- 279 Brookline St Unit 279
- 78 Sargent St
- 11 Mayo Ave
- 277 Brookline St
- 15 Hawthorn Ave
- 42 Hawthorn Ave
- 26 Hawthorn Ave
- 54 Hawthorn Ave
- 131 Fair Oaks Park
- 89 May St Unit 4
- 24 Cleveland Rd
- 19 Oakland Ave Unit 19
- 18 Grant St Unit Rear
- 61 Pleasant St
- 22 Edwardel Rd
- 46 Howland St Unit 46
- 18 Avon Cir
Ask me questions while you tour the home.