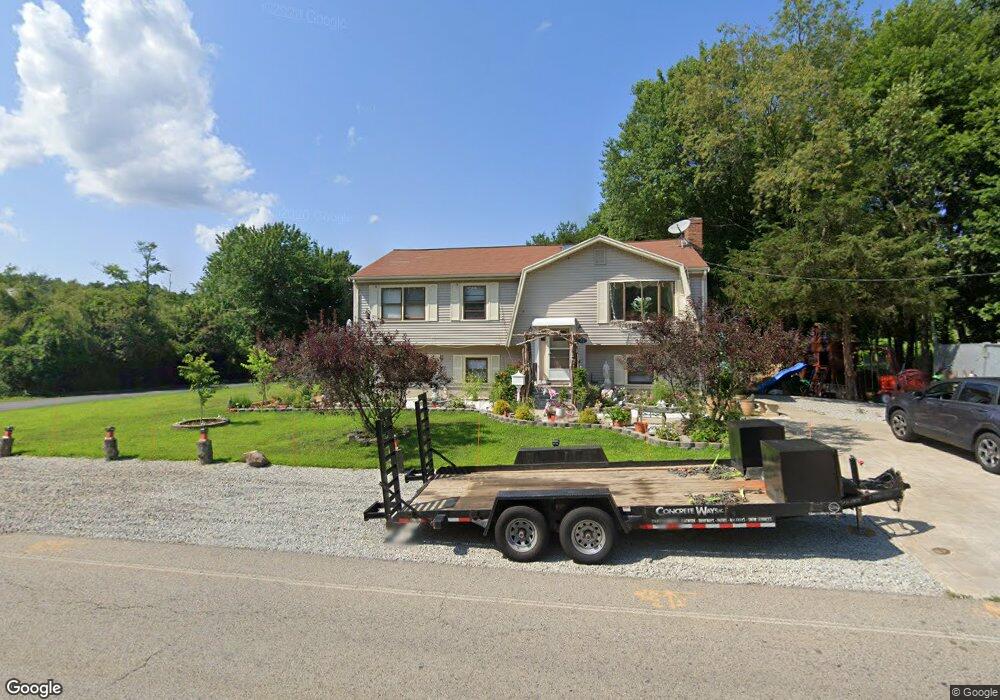
71 Randolph St South Weymouth, MA 02190
Estimated Value: $688,000 - $874,000
4
Beds
2
Baths
2,300
Sq Ft
$346/Sq Ft
Est. Value
About This Home
This home is located at 71 Randolph St, South Weymouth, MA 02190 and is currently estimated at $796,494, approximately $346 per square foot. 71 Randolph St is a home located in Norfolk County with nearby schools including Thomas V Nash, Abigail Adams Middle School, and Weymouth Middle School Chapman.
Ownership History
Date
Name
Owned For
Owner Type
Purchase Details
Closed on
Apr 30, 2008
Sold by
Jackson Carol A and Jackson Norman
Bought by
Le Thao N and Le Thuy
Current Estimated Value
Home Financials for this Owner
Home Financials are based on the most recent Mortgage that was taken out on this home.
Original Mortgage
$288,000
Outstanding Balance
$183,436
Interest Rate
5.99%
Mortgage Type
Purchase Money Mortgage
Estimated Equity
$613,058
Create a Home Valuation Report for This Property
The Home Valuation Report is an in-depth analysis detailing your home's value as well as a comparison with similar homes in the area
Home Values in the Area
Average Home Value in this Area
Purchase History
| Date | Buyer | Sale Price | Title Company |
|---|---|---|---|
| Le Thao N | $360,000 | -- |
Source: Public Records
Mortgage History
| Date | Status | Borrower | Loan Amount |
|---|---|---|---|
| Open | Le Thao N | $288,000 |
Source: Public Records
Tax History Compared to Growth
Tax History
| Year | Tax Paid | Tax Assessment Tax Assessment Total Assessment is a certain percentage of the fair market value that is determined by local assessors to be the total taxable value of land and additions on the property. | Land | Improvement |
|---|---|---|---|---|
| 2025 | $7,259 | $718,700 | $215,300 | $503,400 |
| 2024 | $7,031 | $684,600 | $205,100 | $479,500 |
| 2023 | $5,361 | $513,000 | $189,900 | $323,100 |
| 2022 | $5,214 | $455,000 | $175,900 | $279,100 |
| 2021 | $4,901 | $417,500 | $175,900 | $241,600 |
| 2020 | $4,751 | $398,600 | $175,900 | $222,700 |
| 2019 | $4,520 | $372,900 | $169,100 | $203,800 |
| 2018 | $4,411 | $352,900 | $161,000 | $191,900 |
| 2017 | $4,380 | $341,900 | $153,400 | $188,500 |
| 2016 | $4,243 | $331,500 | $147,500 | $184,000 |
| 2015 | $3,906 | $302,800 | $132,700 | $170,100 |
| 2014 | $3,924 | $295,000 | $137,200 | $157,800 |
Source: Public Records
Map
Nearby Homes
- 77 Randolph St
- 120 Randolph St
- 193 Randolph St
- 30 Alroy Rd
- 1050 Main St Unit 1
- 103 King Philip St
- 63 Forest St
- 203 Pond St
- 65 Fountain Ln Unit 4
- 55 Greentree Ln Unit 27
- 50 Webster St Unit 409
- 7 Woodcrest Ct Unit 4
- 65 Webster St Unit 401
- 55 Fisher Rd
- 45 Union St
- 24 Fisher Rd
- 27 Park Ave
- 740-742 Main St
- 16 Jay Rd
- 68 Massapoag St Unit 7
- 65 Randolph St
- 85 Randolph St
- 74 Randolph St
- 92 Randolph St
- 97 Randolph St
- 90 Randolph St
- 45 Randolph St
- 99 Randolph St
- 96 Randolph St
- 46 Randolph St
- 41 Randolph St
- 98 Randolph St
- 40 Randolph St
- 35 Randolph St
- 22 Rahul Dr
- 107 Randolph St Unit 109
- 105 Randolph St
- 110 Randolph St
- 29 Whitcomb Terrace
- 31 Randolph St