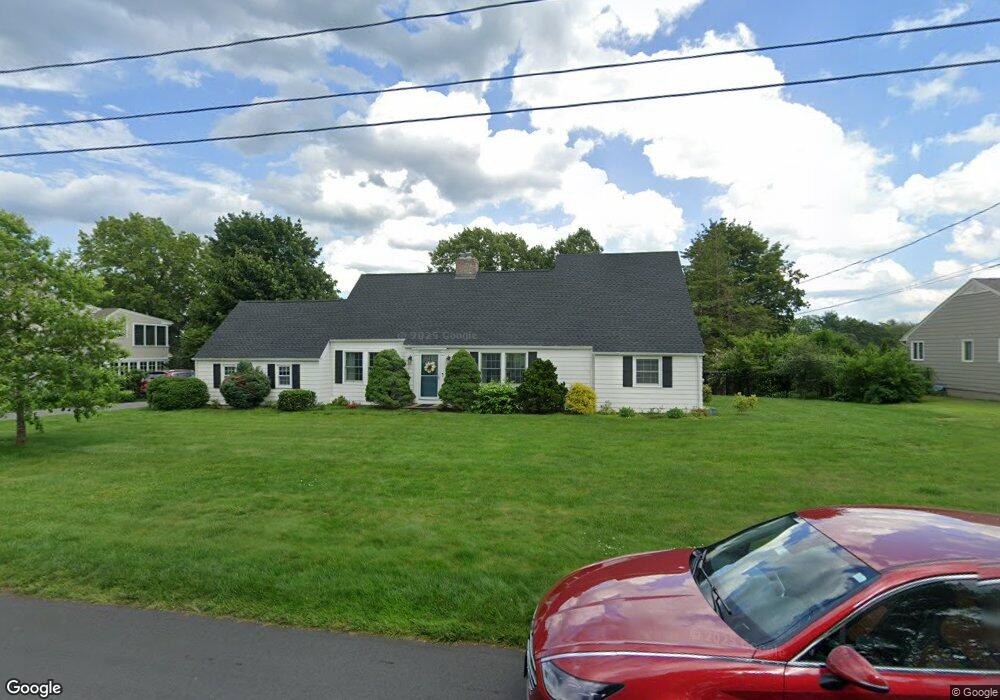
71 Ridge Rd East Longmeadow, MA 01028
Estimated Value: $513,907 - $563,000
3
Beds
3
Baths
2,390
Sq Ft
$223/Sq Ft
Est. Value
About This Home
This home is located at 71 Ridge Rd, East Longmeadow, MA 01028 and is currently estimated at $532,227, approximately $222 per square foot. 71 Ridge Rd is a home located in Hampden County with nearby schools including Meadowbrook Elementary School, Birchland Park Middle School, and East Longmeadow High School.
Ownership History
Date
Name
Owned For
Owner Type
Purchase Details
Closed on
Oct 10, 2012
Sold by
Turner John S and Turner Sandra L
Bought by
Turner Ft and Turner Chelsea E
Current Estimated Value
Purchase Details
Closed on
Oct 9, 1980
Bought by
Turner John S and Turner Sandra L
Create a Home Valuation Report for This Property
The Home Valuation Report is an in-depth analysis detailing your home's value as well as a comparison with similar homes in the area
Home Values in the Area
Average Home Value in this Area
Purchase History
| Date | Buyer | Sale Price | Title Company |
|---|---|---|---|
| Turner Ft | -- | -- | |
| Turner John S | -- | -- |
Source: Public Records
Mortgage History
| Date | Status | Borrower | Loan Amount |
|---|---|---|---|
| Previous Owner | Turner John S | $45,000 | |
| Previous Owner | Turner John S | $76,000 | |
| Previous Owner | Turner John S | $65,000 |
Source: Public Records
Tax History Compared to Growth
Tax History
| Year | Tax Paid | Tax Assessment Tax Assessment Total Assessment is a certain percentage of the fair market value that is determined by local assessors to be the total taxable value of land and additions on the property. | Land | Improvement |
|---|---|---|---|---|
| 2025 | $8,349 | $451,800 | $141,400 | $310,400 |
| 2024 | $7,950 | $428,800 | $141,400 | $287,400 |
| 2023 | $7,530 | $392,200 | $128,400 | $263,800 |
| 2022 | $7,175 | $353,600 | $115,500 | $238,100 |
| 2021 | $7,064 | $335,400 | $106,900 | $228,500 |
| 2020 | $6,750 | $323,900 | $106,900 | $217,000 |
| 2019 | $6,564 | $319,400 | $104,000 | $215,400 |
| 2018 | $6,359 | $303,700 | $104,000 | $199,700 |
| 2017 | $6,177 | $297,400 | $101,800 | $195,600 |
| 2016 | $6,169 | $292,100 | $98,500 | $193,600 |
| 2015 | $6,052 | $292,100 | $98,500 | $193,600 |
Source: Public Records
Map
Nearby Homes