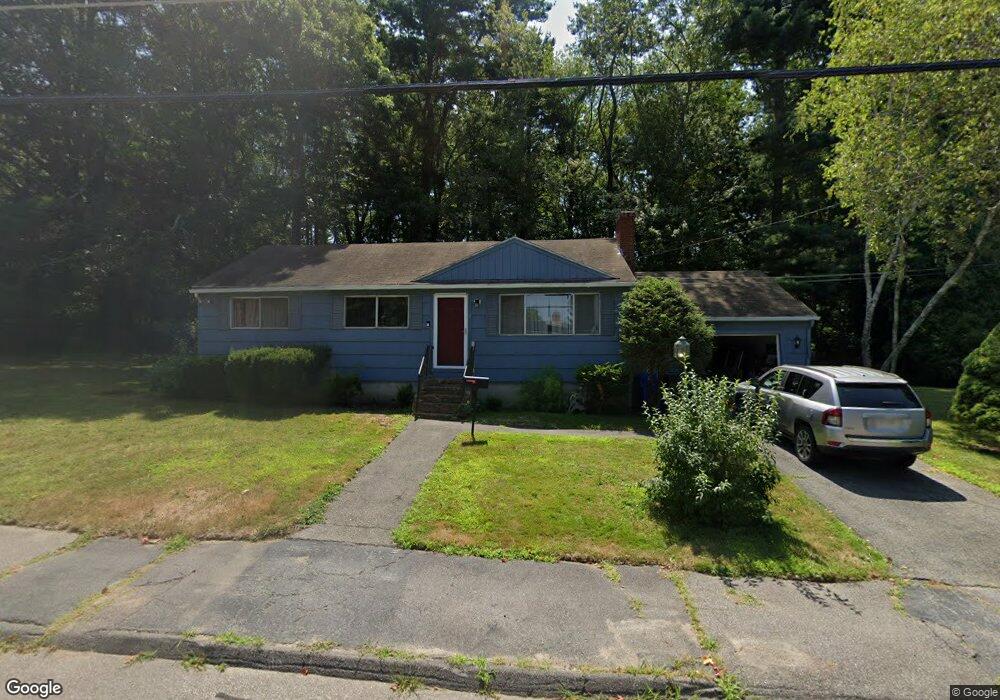
71 Rindone St Holbrook, MA 02343
Estimated Value: $264,000 - $559,649
3
Beds
1
Bath
960
Sq Ft
$417/Sq Ft
Est. Value
About This Home
This home is located at 71 Rindone St, Holbrook, MA 02343 and is currently estimated at $399,912, approximately $416 per square foot. 71 Rindone St is a home located in Norfolk County with nearby schools including John F. Kennedy Elementary School, Holbrook Middle High School, and Boston Higashi School.
Ownership History
Date
Name
Owned For
Owner Type
Purchase Details
Closed on
Apr 4, 2025
Sold by
Chipman Lynne M and Chipman Daniel
Bought by
Chipman Tara L
Current Estimated Value
Home Financials for this Owner
Home Financials are based on the most recent Mortgage that was taken out on this home.
Original Mortgage
$200,000
Outstanding Balance
$199,146
Interest Rate
6.85%
Mortgage Type
Purchase Money Mortgage
Estimated Equity
$200,766
Create a Home Valuation Report for This Property
The Home Valuation Report is an in-depth analysis detailing your home's value as well as a comparison with similar homes in the area
Home Values in the Area
Average Home Value in this Area
Purchase History
| Date | Buyer | Sale Price | Title Company |
|---|---|---|---|
| Chipman Tara L | $250,000 | None Available | |
| Chipman Tara L | $250,000 | None Available |
Source: Public Records
Mortgage History
| Date | Status | Borrower | Loan Amount |
|---|---|---|---|
| Open | Chipman Tara L | $200,000 | |
| Closed | Chipman Tara L | $200,000 |
Source: Public Records
Tax History Compared to Growth
Tax History
| Year | Tax Paid | Tax Assessment Tax Assessment Total Assessment is a certain percentage of the fair market value that is determined by local assessors to be the total taxable value of land and additions on the property. | Land | Improvement |
|---|---|---|---|---|
| 2025 | $6,196 | $470,100 | $272,300 | $197,800 |
| 2024 | $6,104 | $454,200 | $266,400 | $187,800 |
| 2023 | $6,321 | $411,000 | $233,700 | $177,300 |
| 2022 | $6,171 | $374,200 | $222,600 | $151,600 |
| 2021 | $5,924 | $344,000 | $200,600 | $143,400 |
| 2020 | $6,148 | $334,700 | $198,300 | $136,400 |
| 2019 | $5,912 | $303,800 | $173,900 | $129,900 |
| 2018 | $5,916 | $286,200 | $161,000 | $125,200 |
| 2017 | $5,587 | $267,300 | $146,800 | $120,500 |
| 2016 | $5,042 | $256,700 | $138,500 | $118,200 |
| 2015 | $4,629 | $242,600 | $130,200 | $112,400 |
| 2014 | $4,443 | $236,700 | $130,200 | $106,500 |
Source: Public Records
Map
Nearby Homes
- 35 Rindone St
- 34 Reeds Ln
- 19 Bradford St
- 27 Arnold St
- 375 S Franklin St Unit 1
- 610 S Franklin St Unit D304
- 41 Quincy St
- 18 Laurel Park
- 45 King Rd
- 101 Quincy St
- 719 S Franklin St Unit L Block 1
- 719 S Franklin St Unit D Block 1
- 719 S Franklin St Unit C Block 1
- 13 Mayflower Rd
- 14 Fern Rd
- 55 Border Rd
- 181 S Franklin St Unit 102
- 181 S Franklin St Unit 207
- 28 Border Rd
- 360 Plymouth St