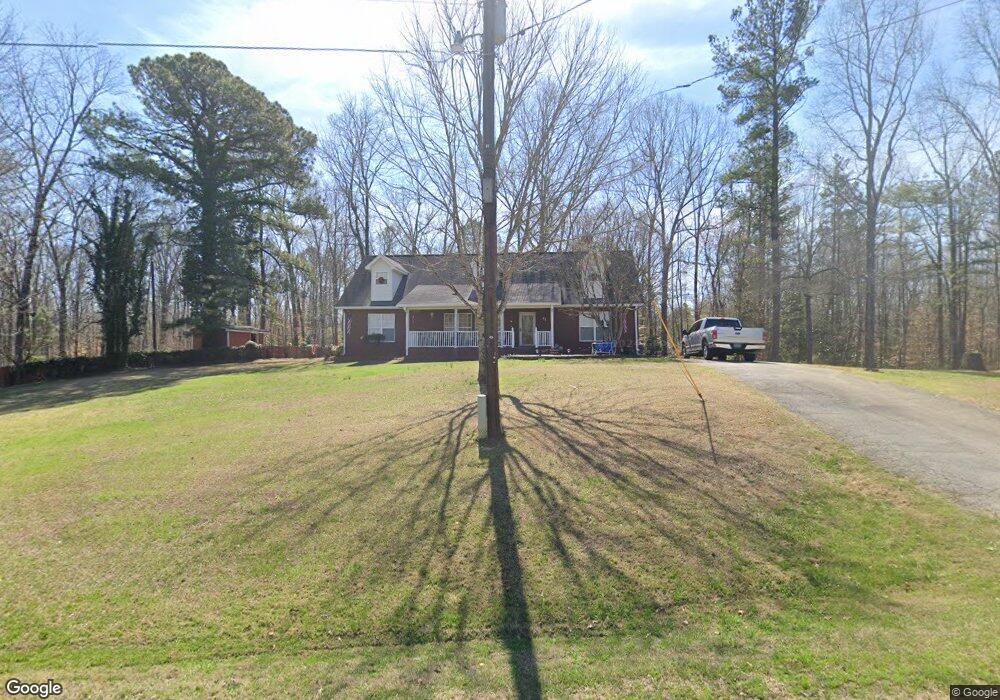
71 Riverside Dr Tallapoosa, GA 30176
Estimated Value: $39,187 - $239,000
3
Beds
1
Bath
1,147
Sq Ft
$150/Sq Ft
Est. Value
About This Home
This home is located at 71 Riverside Dr, Tallapoosa, GA 30176 and is currently estimated at $171,729, approximately $149 per square foot. 71 Riverside Dr is a home located in Haralson County with nearby schools including Haralson County High School.
Ownership History
Date
Name
Owned For
Owner Type
Purchase Details
Closed on
Dec 17, 2008
Sold by
Robinson Billie Jean
Bought by
Robinson Marlow Joseph
Current Estimated Value
Purchase Details
Closed on
Jun 19, 1999
Sold by
Robinson William M
Bought by
Robinson Billie Jean
Purchase Details
Closed on
Jun 17, 1999
Sold by
Robinson Marlow J
Bought by
Robinson Billie Jean
Purchase Details
Closed on
Apr 9, 1999
Sold by
Mcmichael Annie R F and Mcmichael K
Bought by
Robinson Billie Jean
Purchase Details
Closed on
Apr 8, 1999
Sold by
Robinson B Carroll Gary Wayne Harold E
Bought by
Mcmichael Annie R F and Mcmichael K
Purchase Details
Closed on
Jul 5, 1990
Sold by
Mcmichael Annie R F and Mcmichael K
Bought by
Mcmichael Annie Robinson and Mcmichael Robinson
Purchase Details
Closed on
Oct 19, 1983
Sold by
Robinson Bessie Mrs
Bought by
Robinson Bessie Billy Junior Bob
Purchase Details
Closed on
Oct 4, 1944
Sold by
Williamson R W
Bought by
Robinson Bessie Mrs and Annie Lou
Create a Home Valuation Report for This Property
The Home Valuation Report is an in-depth analysis detailing your home's value as well as a comparison with similar homes in the area
Home Values in the Area
Average Home Value in this Area
Purchase History
| Date | Buyer | Sale Price | Title Company |
|---|---|---|---|
| Robinson Marlow Joseph | -- | -- | |
| Robinson Billie Jean | -- | -- | |
| Robinson Billie Jean | -- | -- | |
| Robinson Billie Jean | -- | -- | |
| Mcmichael Annie R F | -- | -- | |
| Mcmichael Annie Robinson | -- | -- | |
| Robinson Bessie Billy Junior Bob | -- | -- | |
| Robinson Bessie Mrs | -- | -- |
Source: Public Records
Tax History Compared to Growth
Tax History
| Year | Tax Paid | Tax Assessment Tax Assessment Total Assessment is a certain percentage of the fair market value that is determined by local assessors to be the total taxable value of land and additions on the property. | Land | Improvement |
|---|---|---|---|---|
| 2024 | $110 | $4,241 | $2,298 | $1,943 |
| 2023 | $174 | $6,730 | $3,974 | $2,756 |
| 2022 | $163 | $6,094 | $3,974 | $2,120 |
| 2021 | $162 | $5,810 | $3,796 | $2,014 |
| 2020 | $171 | $6,097 | $3,796 | $2,301 |
| 2019 | $171 | $5,860 | $3,796 | $2,064 |
| 2018 | $173 | $5,860 | $3,796 | $2,064 |
| 2017 | $172 | $5,608 | $3,796 | $1,812 |
| 2016 | $231 | $7,543 | $3,585 | $3,958 |
| 2015 | $228 | $7,420 | $3,585 | $3,835 |
| 2014 | $224 | $7,420 | $3,585 | $3,835 |
Source: Public Records
Map
Nearby Homes
- 302 Riverside Rd
- 10 + - Acres On J Davis Rd
- 0 J Davis Rd Unit LotWP001
- 78 Cook St
- Off Us Hwy 78 Unit LotWP001
- 295 J Davis Rd Unit LotWP001
- 1304 Broad St
- 267 Williams Rd
- 3055 Providence Church Rd
- 3112 Providence Church Rd
- 0 George Green Rd Unit 10614283
- 0 George Green Rd Unit 148073
- 0 George Green Rd Unit 148074
- 0 George Green Rd Unit 10558286
- 0 George Green Rd Unit 10558285
- 2234 Providence Church Rd
- 110 Dunson Rd
- 28 McDonald Ridge
- 0 Providence Lake Rd Unit 10576961
- 135 Oakland Ct
- 71 Riverside Dr
- 115 Riverside Dr
- 272 Riverside Rd
- 135 Riverside Dr
- 136 Riverside Dr
- 181 Riverside Dr
- 196 Riverside Rd
- 403 Riverside Rd
- 16 Goose Creek Rd
- 255 Riverside Dr
- 366 Riverside Rd
- 1046 U S Highway 78
- 900 U S Highway 78
- 900 Us Highway 78
- 900 U S 78
- 900 Us Hwy 78
- 65 Goose Creek Rd
- 439 Riverside Rd
- 139 Riverside Rd
- 217 Riverside Dr