
Seller's Agent in 2025
Theresa Godin
Conway - Canton
(617) 686-0063
1 in this area
54 Total Sales
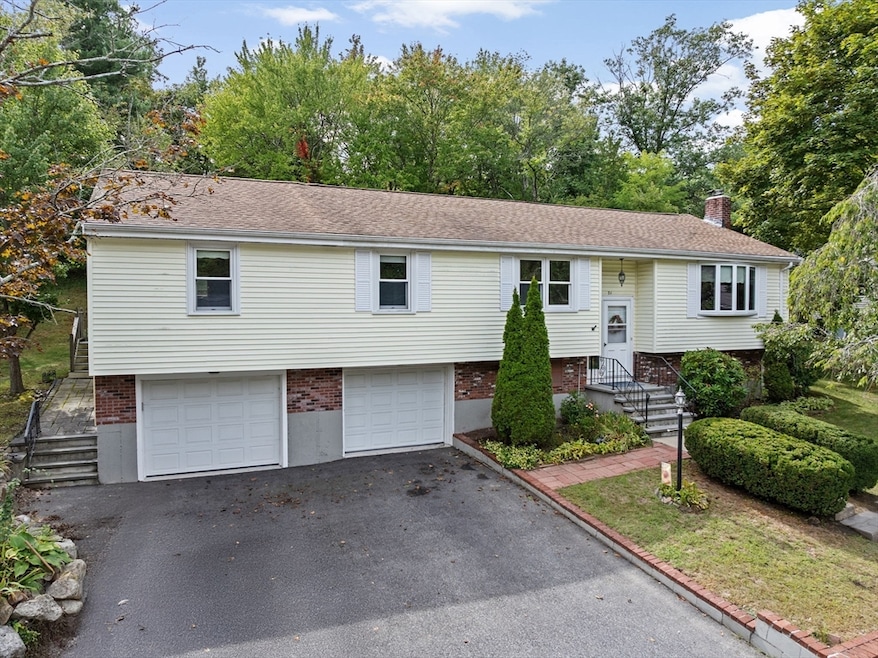
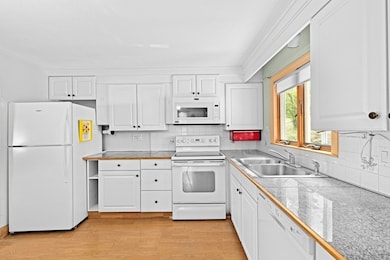
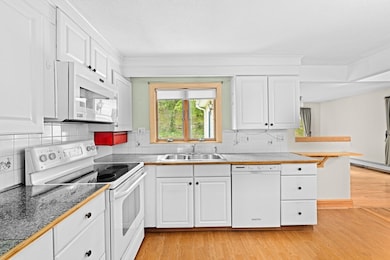
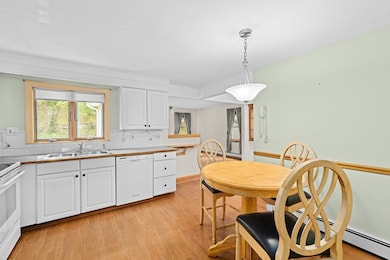
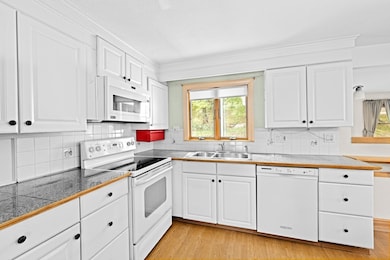
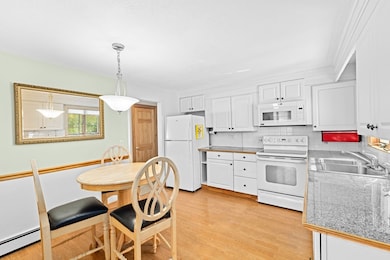
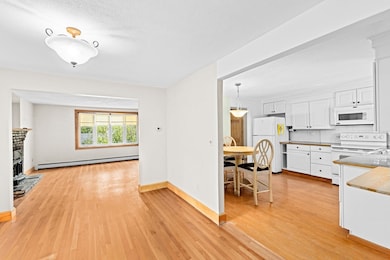
Welcome to 71 Robbie Rd, Braintree, offering an exciting opportunity to establish yourself in a highly desirable area. With 2,615 square feet of living space this split-level style home features 9 rooms, 3 bedrooms, 3 full bathrooms and is situated on a sizable 15,050 square foot lot. Your white cabinet kitchen has granite tile countertops and a tile backsplash. Spacious living room has hardwood floors, a fireplace and flows into your dining room with hardwood floors and a built-in display cabinet. Fabulous 1st floor family room (2010) with a door to your trex deck. Sizable primary bedroom (2017) has hardwood floors, exterior access to another trex deck. Primary bath with shower stall and tile flooring. 2 additional bedrooms with hardwood floors and a main bath complete your 1st level. Lower-level playroom, office and full bath. Great in-law potential. Newer front steps. Anderson windows (2010). Close to the highway, commuter train and red line for easy access to Boston.
| Date | Type | Sale Price | Title Company |
|---|---|---|---|
| Quit Claim Deed | $818,000 | -- | |
| Deed | $359,900 | -- | |
| Deed | $188,000 | -- |
| Date | Status | Loan Amount | Loan Type |
|---|---|---|---|
| Open | $611,250 | New Conventional | |
| Previous Owner | $100,000 | Unknown | |
| Previous Owner | $106,000 | No Value Available | |
| Previous Owner | $110,000 | Purchase Money Mortgage |
| Date | Event | Price | List to Sale | Price per Sq Ft |
|---|---|---|---|---|
| 11/18/2025 11/18/25 | Sold | $818,000 | -3.8% | $313 / Sq Ft |
| 09/30/2025 09/30/25 | Pending | -- | -- | -- |
| 09/10/2025 09/10/25 | For Sale | $849,900 | -- | $325 / Sq Ft |
| Year | Tax Paid | Tax Assessment Tax Assessment Total Assessment is a certain percentage of the fair market value that is determined by local assessors to be the total taxable value of land and additions on the property. | Land | Improvement |
|---|---|---|---|---|
| 2025 | $7,492 | $750,700 | $379,400 | $371,300 |
| 2024 | $6,702 | $707,000 | $349,500 | $357,500 |
| 2023 | $6,390 | $654,700 | $319,500 | $335,200 |
| 2022 | $6,117 | $614,800 | $279,600 | $335,200 |
| 2021 | $5,737 | $576,600 | $252,600 | $324,000 |
| 2020 | $5,458 | $553,600 | $229,600 | $324,000 |
| 2019 | $5,289 | $524,200 | $229,600 | $294,600 |
| 2018 | $4,405 | $417,900 | $199,700 | $218,200 |
| 2017 | $4,254 | $396,100 | $189,700 | $206,400 |
| 2016 | $4,165 | $379,300 | $179,700 | $199,600 |
| 2015 | $4,136 | $373,600 | $175,700 | $197,900 |
| 2014 | $3,747 | $328,100 | $152,800 | $175,300 |
Seller's Agent in 2025
Theresa Godin
Conway - Canton
(617) 686-0063
1 in this area
54 Total Sales
Buyer's Agent in 2025
Jay Su
East West Real Estate, LLC
(917) 945-2982
1 in this area
22 Total Sales
Source: MLS Property Information Network (MLS PIN)
MLS Number: 73429163
APN: BRAI-003027-000000-000009A
Disclaimer: Certain information contained herein is derived from information provided by parties other than Homes.com. All information provided is deemed reliable, but is not guaranteed to be accurate and should be independently verified.
![]() The property listing data and information, or the Images, set forth herein were provided to MLS Property Information Network, Inc. from third party sources, including sellers, lessors and public records, and were compiled by MLS Property Information Network, Inc. The property listing data and information, and the Images, are for the personal, non-commercial use of consumers having a good faith interest in purchasing or leasing listed properties of the type displayed to them and may not be used for any purpose other than to identify prospective properties which such consumers may have a good faith interest in purchasing or leasing. MLS Property Information Network, Inc. and its subscribers disclaim any and all representations and warranties as to the accuracy of the property listing data and information, or as to the accuracy of any of the Images, set forth herein.
The property listing data and information, or the Images, set forth herein were provided to MLS Property Information Network, Inc. from third party sources, including sellers, lessors and public records, and were compiled by MLS Property Information Network, Inc. The property listing data and information, and the Images, are for the personal, non-commercial use of consumers having a good faith interest in purchasing or leasing listed properties of the type displayed to them and may not be used for any purpose other than to identify prospective properties which such consumers may have a good faith interest in purchasing or leasing. MLS Property Information Network, Inc. and its subscribers disclaim any and all representations and warranties as to the accuracy of the property listing data and information, or as to the accuracy of any of the Images, set forth herein.
Ask me questions while you tour the home.