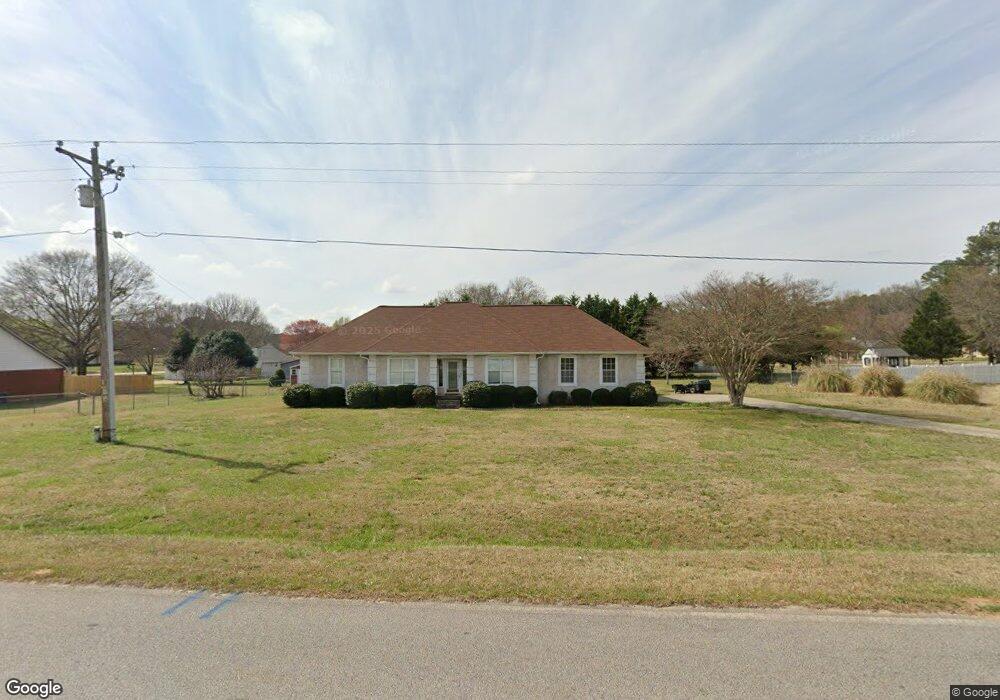
71 Rosser Rd McDonough, GA 30252
Estimated Value: $276,000 - $299,000
3
Beds
2
Baths
1,750
Sq Ft
$163/Sq Ft
Est. Value
About This Home
This home is located at 71 Rosser Rd, McDonough, GA 30252 and is currently estimated at $284,941, approximately $162 per square foot. 71 Rosser Rd is a home located in Henry County with nearby schools including Tussahaw Elementary School, McDonough Middle School, and New Creation Christian Academy.
Ownership History
Date
Name
Owned For
Owner Type
Purchase Details
Closed on
Apr 13, 2018
Sold by
Parks Hayne B
Bought by
Trussell Denise and Trussell Carl
Current Estimated Value
Home Financials for this Owner
Home Financials are based on the most recent Mortgage that was taken out on this home.
Original Mortgage
$120,314
Outstanding Balance
$103,986
Interest Rate
4.75%
Mortgage Type
FHA
Estimated Equity
$180,955
Purchase Details
Closed on
Feb 24, 2000
Sold by
Flowers Jjames R and Flowers Tammy
Bought by
Parks Gregory J and Parks Hayne B
Home Financials for this Owner
Home Financials are based on the most recent Mortgage that was taken out on this home.
Original Mortgage
$112,450
Interest Rate
8.21%
Mortgage Type
New Conventional
Purchase Details
Closed on
May 4, 1993
Sold by
High Top Holdings
Bought by
Flowers James R and Flowers Tammy
Home Financials for this Owner
Home Financials are based on the most recent Mortgage that was taken out on this home.
Original Mortgage
$81,730
Interest Rate
7.51%
Mortgage Type
FHA
Create a Home Valuation Report for This Property
The Home Valuation Report is an in-depth analysis detailing your home's value as well as a comparison with similar homes in the area
Home Values in the Area
Average Home Value in this Area
Purchase History
| Date | Buyer | Sale Price | Title Company |
|---|---|---|---|
| Trussell Denise | $130,000 | -- | |
| Parks Gregory J | $118,400 | -- | |
| Flowers James R | $83,000 | -- |
Source: Public Records
Mortgage History
| Date | Status | Borrower | Loan Amount |
|---|---|---|---|
| Open | Trussell Denise | $120,314 | |
| Previous Owner | Parks Gregory J | $112,450 | |
| Previous Owner | Flowers James R | $81,730 |
Source: Public Records
Tax History Compared to Growth
Tax History
| Year | Tax Paid | Tax Assessment Tax Assessment Total Assessment is a certain percentage of the fair market value that is determined by local assessors to be the total taxable value of land and additions on the property. | Land | Improvement |
|---|---|---|---|---|
| 2025 | $4,815 | $120,800 | $18,000 | $102,800 |
| 2024 | $4,815 | $108,960 | $18,000 | $90,960 |
| 2023 | $4,000 | $103,240 | $16,000 | $87,240 |
| 2022 | $3,330 | $85,760 | $16,000 | $69,760 |
| 2021 | $2,843 | $73,080 | $16,000 | $57,080 |
| 2020 | $2,389 | $61,240 | $12,000 | $49,240 |
| 2019 | $2,035 | $52,000 | $10,192 | $41,808 |
| 2018 | $1,875 | $56,040 | $10,800 | $45,240 |
| 2016 | $1,757 | $51,840 | $10,000 | $41,840 |
| 2015 | $1,435 | $42,560 | $7,200 | $35,360 |
| 2014 | $1,309 | $39,080 | $7,200 | $31,880 |
Source: Public Records
Map
Nearby Homes
- 1449 Highway 81 E
- 125 Steeplechase Dr
- 325 Rosser Rd
- 150 Sterling Ave
- 5 Wellington Dr
- 1891 Highway 81 E
- 1926 King Mill Rd
- 1916 King Mill Rd
- 1936 King Mill Rd
- 466 Best Friends Turn Alley
- 312 Amble Side
- 120 N Bethany Rd
- 297 Aylesbury Blvd
- 292 Aylesbury Blvd
- 289 Aylesbury Blvd
- 500 Elkwood Ln
- 512 Elkwood Ln
- 536 Elkwood Ln
- 242 Old Jackson Rd
- 1324 Cochran Crossing
- 91 Rosser Rd
- 201 Compton Ct
- 100 Overlook Dr
- 102 Overlook Dr
- 86 Rosser Rd
- 0 Compton Ct Unit 8771993
- 0 Compton Ct Unit 8653557
- 0 Compton Ct Unit 8149247
- 59 Rosser Rd
- 203 Compton Ct
- 104 Overlook Dr
- 121 Rosser Rd
- 80 Rosser Rd
- 101 Overlook Dr
- 103 Overlook Dr
- 106 Overlook Dr
- 202 Compton Ct
- 30 Rosser Rd
- 205 Compton Ct
- 204 Compton Ct