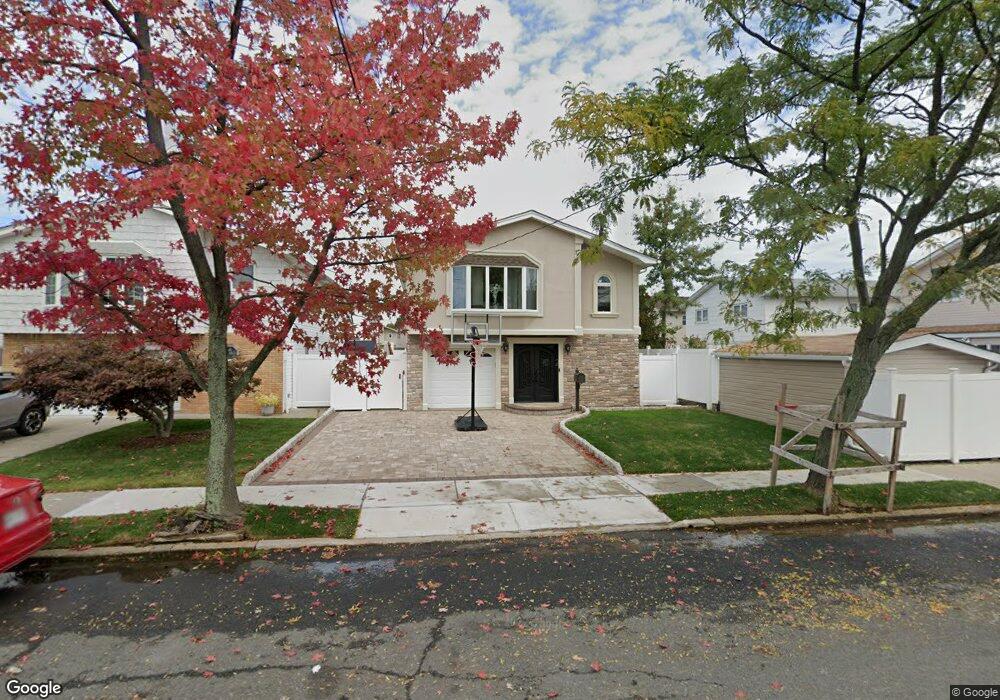
71 Scranton Ave Staten Island, NY 10312
Eltingville NeighborhoodEstimated Value: $770,839 - $1,028,000
--
Bed
4
Baths
2,104
Sq Ft
$428/Sq Ft
Est. Value
About This Home
This home is located at 71 Scranton Ave, Staten Island, NY 10312 and is currently estimated at $900,460, approximately $427 per square foot. 71 Scranton Ave is a home located in Richmond County with nearby schools including P.S. 42 The Eltingville School, I.S. 007 Elias Bernstein, and Tottenville High School.
Ownership History
Date
Name
Owned For
Owner Type
Purchase Details
Closed on
Nov 22, 2022
Sold by
Martino Gilberto
Bought by
1031 Liu Inc
Current Estimated Value
Purchase Details
Closed on
Jun 18, 2008
Sold by
Rivera Betzaida
Bought by
Martino Betzaida
Home Financials for this Owner
Home Financials are based on the most recent Mortgage that was taken out on this home.
Original Mortgage
$3,196
Interest Rate
6.35%
Mortgage Type
Purchase Money Mortgage
Purchase Details
Closed on
Feb 4, 2003
Sold by
Paone Guy and Paone Mary
Bought by
Rivera Betzaida
Home Financials for this Owner
Home Financials are based on the most recent Mortgage that was taken out on this home.
Original Mortgage
$330,000
Interest Rate
5.95%
Mortgage Type
Purchase Money Mortgage
Create a Home Valuation Report for This Property
The Home Valuation Report is an in-depth analysis detailing your home's value as well as a comparison with similar homes in the area
Home Values in the Area
Average Home Value in this Area
Purchase History
| Date | Buyer | Sale Price | Title Company |
|---|---|---|---|
| 1031 Liu Inc | $769,000 | -- | |
| Martino Betzaida | -- | Titleserv Inc | |
| Rivera Betzaida | $430,000 | Hamilton Title Agency |
Source: Public Records
Mortgage History
| Date | Status | Borrower | Loan Amount |
|---|---|---|---|
| Previous Owner | Martino Betzaida | $3,196 | |
| Previous Owner | Rivera Betzaida | $330,000 |
Source: Public Records
Tax History Compared to Growth
Tax History
| Year | Tax Paid | Tax Assessment Tax Assessment Total Assessment is a certain percentage of the fair market value that is determined by local assessors to be the total taxable value of land and additions on the property. | Land | Improvement |
|---|---|---|---|---|
| 2025 | $7,528 | $52,140 | $9,106 | $43,034 |
| 2024 | $3,635 | $51,720 | $8,660 | $43,060 |
| 2023 | $3,664 | $38,880 | $8,123 | $30,757 |
| 2022 | $7,416 | $47,100 | $11,520 | $35,580 |
| 2021 | $7,358 | $48,480 | $11,520 | $36,960 |
| 2020 | $6,974 | $44,280 | $11,520 | $32,760 |
| 2019 | $6,485 | $42,180 | $11,520 | $30,660 |
| 2018 | $6,307 | $32,400 | $9,541 | $22,859 |
| 2017 | $6,256 | $32,157 | $10,947 | $21,210 |
| 2016 | $5,755 | $30,337 | $10,766 | $19,571 |
| 2015 | $4,877 | $28,620 | $8,480 | $20,140 |
| 2014 | $4,877 | $27,000 | $9,600 | $17,400 |
Source: Public Records
Map
Nearby Homes
- 688 Leverett Ave Unit 8520
- 457 Genesee Ave
- 50 Reading Ave
- 3452 Richmond Ave
- 71 Reading Ave
- 634 Leverett Ave
- 110 Lovelace Ave
- 102 Lovelace Ave
- 682 Barlow Ave
- 696 Katan Ave
- 171 Figurea Ave
- 320 Genesee Ave
- 296 Eltingville Blvd
- 622 Barlow Ave
- 292 Eltingville Blvd
- 288 Eltingville Blvd
- 731 Barlow Ave
- 284 Eltingville Blvd
- 774 Barlow Ave
- 280 Eltingville Blvd
- 75 Scranton Ave
- 310 Wainwright Ave
- 314 Wainwright Ave
- 79 Scranton Ave
- 306 Wainwright Ave
- 72 Stroud Ave
- 76 Stroud Ave
- 302 Wainwright Ave
- 83 Scranton Ave
- 80 Stroud Ave
- 320 Wainwright Ave
- 298 Wainwright Ave
- 70 Scranton Ave
- 85 Scranton Ave
- 74 Scranton Ave
- 78 Scranton Ave
- 324 Wainwright Ave
- 90 Stroud Ave
- 82 Scranton Ave
- 328 Wainwright Ave