Estimated Value: $109,000 - $146,639
3
Beds
1
Bath
1,318
Sq Ft
$97/Sq Ft
Est. Value
About This Home
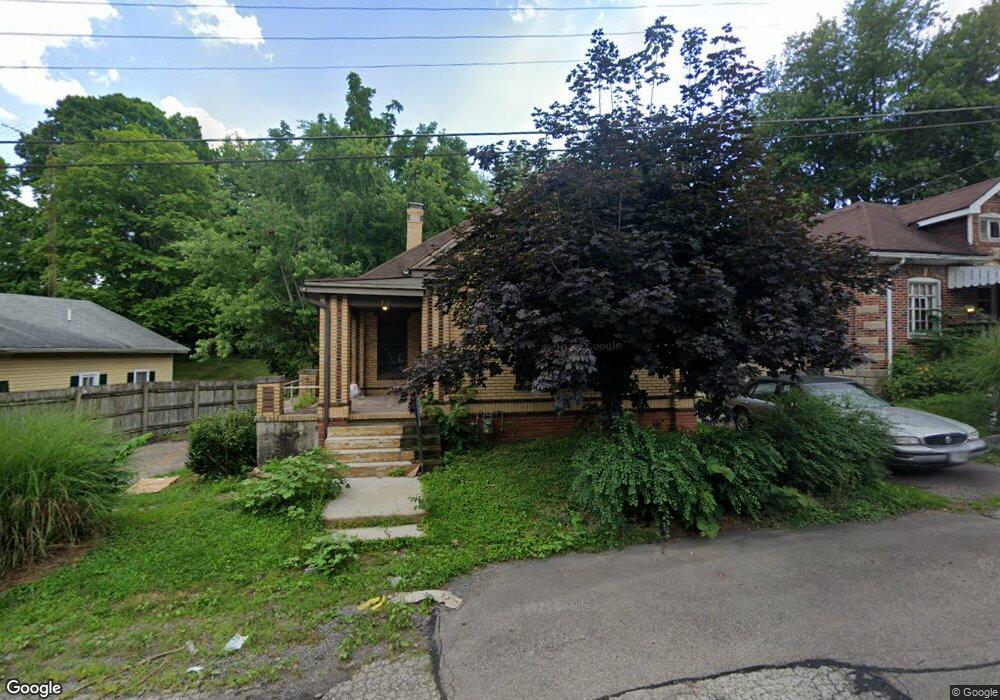
This home is located at 71 Spring St, Xenia, OH 45385 and is currently estimated at $127,910, approximately $97 per square foot. 71 Spring St is a home located in Greene County with nearby schools including Xenia High School, Summit Academy Community School for Alternative Learners - Xenia, and Legacy Christian Academy.
Ownership History
Date
Name
Owned For
Owner Type
Purchase Details
Closed on
Mar 29, 2022
Sold by
Mtglq Investors Lp
Bought by
Loxley Martin Llc
Current Estimated Value
Home Financials for this Owner
Home Financials are based on the most recent Mortgage that was taken out on this home.
Original Mortgage
$57,600
Outstanding Balance
$53,659
Interest Rate
4.42%
Mortgage Type
New Conventional
Estimated Equity
$74,251
Purchase Details
Closed on
Jan 7, 2022
Sold by
Kruse Richard F
Bought by
Grant Sell And Convey Unto Mtglo Investors Lp
Purchase Details
Closed on
May 16, 2005
Sold by
Perry Myna A and Perry John A
Bought by
Zappin R A Brandon and Zappin Kimberly
Home Financials for this Owner
Home Financials are based on the most recent Mortgage that was taken out on this home.
Original Mortgage
$76,000
Interest Rate
7.87%
Mortgage Type
Fannie Mae Freddie Mac
Create a Home Valuation Report for This Property
The Home Valuation Report is an in-depth analysis detailing your home's value as well as a comparison with similar homes in the area
Home Values in the Area
Average Home Value in this Area
Purchase History
| Date | Buyer | Sale Price | Title Company |
|---|---|---|---|
| Loxley Martin Llc | $117,000 | First Ohio Title | |
| Grant Sell And Convey Unto Mtglo Investors Lp | $60,000 | Manley Deas Kochalski Llc | |
| Zappin R A Brandon | $95,000 | -- |
Source: Public Records
Mortgage History
| Date | Status | Borrower | Loan Amount |
|---|---|---|---|
| Open | Loxley Martin Llc | $57,600 | |
| Previous Owner | Zappin R A Brandon | $76,000 | |
| Closed | Zappin R A Brandon | $19,000 |
Source: Public Records
Tax History
| Year | Tax Paid | Tax Assessment Tax Assessment Total Assessment is a certain percentage of the fair market value that is determined by local assessors to be the total taxable value of land and additions on the property. | Land | Improvement |
|---|---|---|---|---|
| 2025 | $1,211 | $27,810 | $4,380 | $23,430 |
| 2024 | $1,211 | $27,810 | $4,380 | $23,430 |
| 2023 | $1,190 | $27,810 | $4,380 | $23,430 |
| 2022 | $1,646 | $32,810 | $3,500 | $29,310 |
| 2021 | $1,668 | $32,810 | $3,500 | $29,310 |
| 2020 | $4,686 | $32,810 | $3,500 | $29,310 |
| 2019 | $1,609 | $31,100 | $3,400 | $27,700 |
| 2018 | $1,616 | $31,100 | $3,400 | $27,700 |
| 2017 | $1,545 | $31,100 | $3,400 | $27,700 |
| 2016 | $1,546 | $29,200 | $3,400 | $25,800 |
| 2015 | $1,550 | $29,200 | $3,400 | $25,800 |
| 2014 | $1,484 | $29,200 | $3,400 | $25,800 |
Source: Public Records
Map
Nearby Homes
Your Personal Tour Guide
Ask me questions while you tour the home.