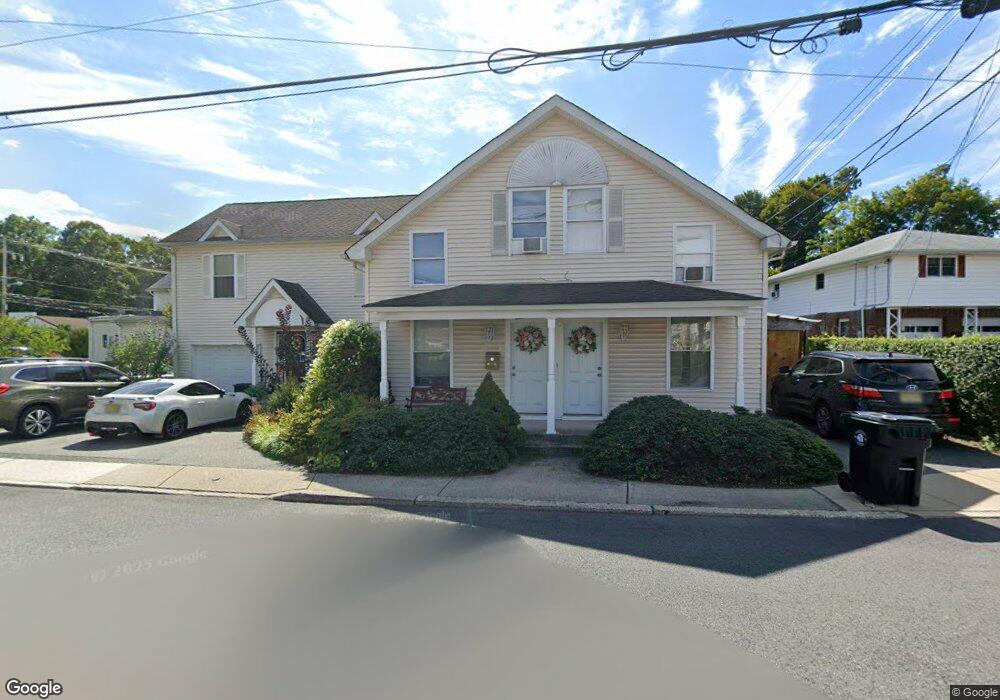
71 Stoll St Unit 73 Netcong, NJ 07857
Estimated Value: $538,000 - $686,000
--
Bed
--
Bath
3,309
Sq Ft
$189/Sq Ft
Est. Value
About This Home
This home is located at 71 Stoll St Unit 73, Netcong, NJ 07857 and is currently estimated at $625,106, approximately $188 per square foot. 71 Stoll St Unit 73 is a home located in Morris County with nearby schools including Netcong Elementary School and Lenape Val Regional High School.
Ownership History
Date
Name
Owned For
Owner Type
Purchase Details
Closed on
Oct 10, 2005
Sold by
Triplett Douglas
Bought by
Williams Vincia
Current Estimated Value
Home Financials for this Owner
Home Financials are based on the most recent Mortgage that was taken out on this home.
Original Mortgage
$359,200
Outstanding Balance
$191,776
Interest Rate
5.72%
Estimated Equity
$433,331
Purchase Details
Closed on
Mar 31, 2000
Sold by
Triplett Douglas and Brigham Sharon
Bought by
Triplett Douglas
Purchase Details
Closed on
Aug 2, 1996
Sold by
Scordato Mark
Bought by
Triplett Douglas and Triplett Sharon B
Home Financials for this Owner
Home Financials are based on the most recent Mortgage that was taken out on this home.
Original Mortgage
$155,000
Interest Rate
8.25%
Create a Home Valuation Report for This Property
The Home Valuation Report is an in-depth analysis detailing your home's value as well as a comparison with similar homes in the area
Home Values in the Area
Average Home Value in this Area
Purchase History
| Date | Buyer | Sale Price | Title Company |
|---|---|---|---|
| Williams Vincia | $449,000 | -- | |
| Triplett Douglas | -- | -- | |
| Triplett Douglas | $164,500 | -- |
Source: Public Records
Mortgage History
| Date | Status | Borrower | Loan Amount |
|---|---|---|---|
| Open | Williams Vincia | $359,200 | |
| Previous Owner | Triplett Douglas | $155,000 |
Source: Public Records
Tax History Compared to Growth
Tax History
| Year | Tax Paid | Tax Assessment Tax Assessment Total Assessment is a certain percentage of the fair market value that is determined by local assessors to be the total taxable value of land and additions on the property. | Land | Improvement |
|---|---|---|---|---|
| 2025 | $14,529 | $425,200 | $110,500 | $314,700 |
| 2024 | $14,657 | $425,200 | $110,500 | $314,700 |
| 2023 | $14,657 | $425,200 | $110,500 | $314,700 |
| 2022 | $12,434 | $425,200 | $110,500 | $314,700 |
| 2021 | $12,434 | $425,200 | $110,500 | $314,700 |
| 2020 | $13,537 | $440,100 | $165,900 | $274,200 |
| 2019 | $12,886 | $440,100 | $165,900 | $274,200 |
| 2018 | $12,116 | $440,100 | $165,900 | $274,200 |
| 2017 | $11,641 | $440,100 | $165,900 | $274,200 |
| 2016 | $11,324 | $440,100 | $165,900 | $274,200 |
| 2015 | $10,910 | $440,100 | $165,900 | $274,200 |
| 2014 | $10,435 | $440,100 | $165,900 | $274,200 |
Source: Public Records
Map
Nearby Homes