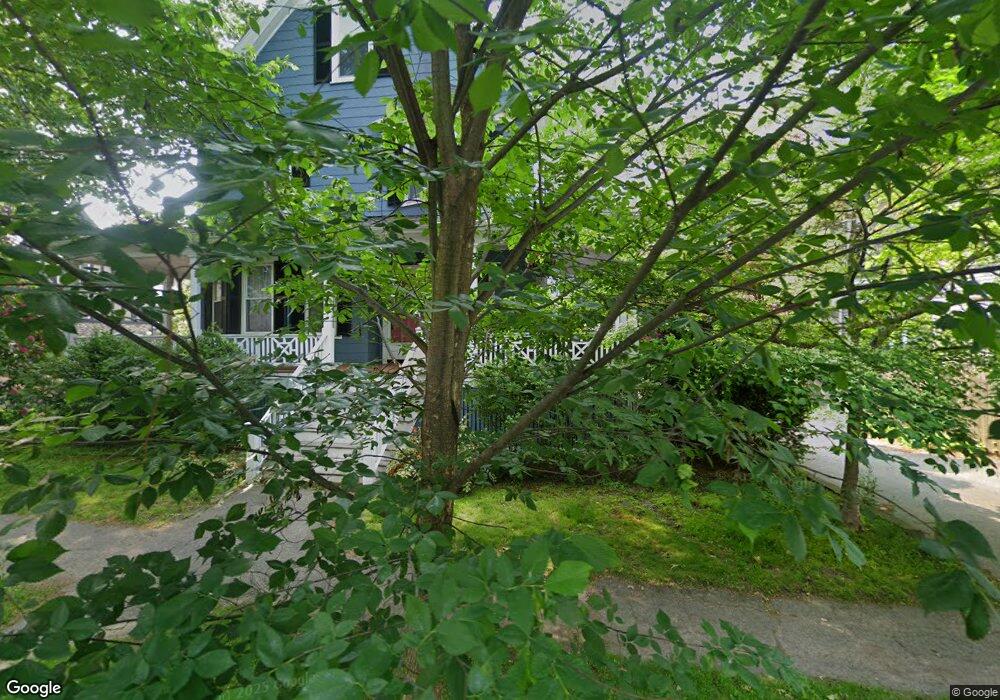
71 Thomas Rd Swampscott, MA 01907
Estimated Value: $968,000 - $1,111,000
4
Beds
3
Baths
2,111
Sq Ft
$484/Sq Ft
Est. Value
About This Home
This home is located at 71 Thomas Rd, Swampscott, MA 01907 and is currently estimated at $1,021,976, approximately $484 per square foot. 71 Thomas Rd is a home located in Essex County with nearby schools including Swampscott Middle School and Swampscott High School.
Ownership History
Date
Name
Owned For
Owner Type
Purchase Details
Closed on
Feb 27, 1998
Sold by
Maclaurin Colin and Maclaurin Jeanne
Bought by
Thomsen Ian K and Thomsen Maureen T
Current Estimated Value
Purchase Details
Closed on
Apr 1, 1992
Sold by
Murphy Daniel W
Bought by
Maclaurin Colin and Maclaurin Jeanne
Create a Home Valuation Report for This Property
The Home Valuation Report is an in-depth analysis detailing your home's value as well as a comparison with similar homes in the area
Home Values in the Area
Average Home Value in this Area
Purchase History
| Date | Buyer | Sale Price | Title Company |
|---|---|---|---|
| Thomsen Ian K | $288,000 | -- | |
| Thomsen Ian K | $288,000 | -- | |
| Maclaurin Colin | $185,000 | -- | |
| Maclaurin Colin | $185,000 | -- |
Source: Public Records
Mortgage History
| Date | Status | Borrower | Loan Amount |
|---|---|---|---|
| Open | Maclaurin Colin | $208,000 | |
| Closed | Maclaurin Colin | $150,000 |
Source: Public Records
Tax History
| Year | Tax Paid | Tax Assessment Tax Assessment Total Assessment is a certain percentage of the fair market value that is determined by local assessors to be the total taxable value of land and additions on the property. | Land | Improvement |
|---|---|---|---|---|
| 2025 | $9,775 | $852,200 | $342,300 | $509,900 |
| 2024 | $9,471 | $824,300 | $325,600 | $498,700 |
| 2023 | $8,738 | $744,300 | $292,200 | $452,100 |
| 2022 | $8,161 | $636,100 | $250,500 | $385,600 |
| 2021 | $8,453 | $612,500 | $233,800 | $378,700 |
| 2020 | $8,340 | $583,200 | $208,700 | $374,500 |
| 2019 | $8,547 | $562,300 | $187,800 | $374,500 |
| 2018 | $8,362 | $522,600 | $171,100 | $351,500 |
| 2017 | $8,530 | $488,800 | $160,300 | $328,500 |
| 2016 | $8,471 | $488,800 | $160,300 | $328,500 |
| 2015 | $8,383 | $488,800 | $160,300 | $328,500 |
| 2014 | $7,704 | $412,000 | $133,600 | $278,400 |
Source: Public Records
Map
Nearby Homes
- 40 Andrew Rd
- 108-110 Burrill St Unit 1
- 146 Burrill St
- 11 Boynton St Unit 104
- 11 Boynton St Unit 101
- 11 Boynton St Unit 102
- 11 Boynton St Unit 103
- 11 Boynton St Unit 204
- 28 Claremont Terrace Unit 6
- 80 Norfolk Ave Unit 1
- 106 Norfolk Ave
- 178 Norfolk Ave
- 32 Kings Beach Terrace
- 64 Stetson Ave
- 97 Seymour Ave
- 1 Bond St
- 51 Mountwood Rd
- 50 Mountwood Rd
- 306 Paradise Rd
- 40 Buena Vista St
Your Personal Tour Guide
Ask me questions while you tour the home.