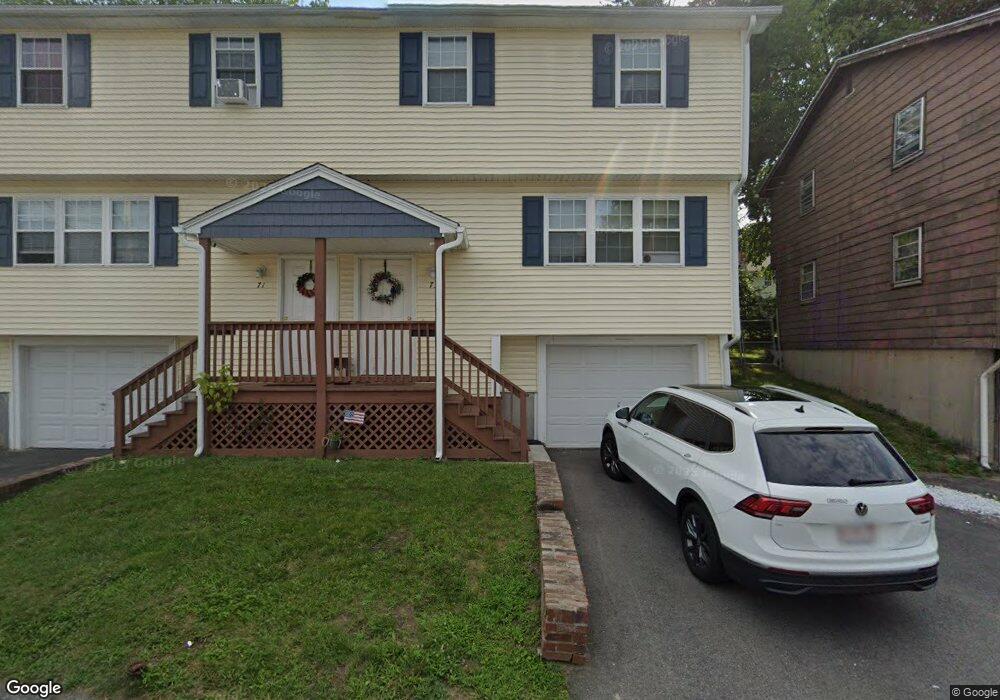
71 Thornton St Unit 73 Lawrence, MA 01841
Prospect Hill-Back Bay NeighborhoodEstimated Value: $620,915 - $788,000
6
Beds
3
Baths
2,262
Sq Ft
$314/Sq Ft
Est. Value
About This Home
This home is located at 71 Thornton St Unit 73, Lawrence, MA 01841 and is currently estimated at $710,479, approximately $314 per square foot. 71 Thornton St Unit 73 is a home located in Essex County with nearby schools including Olive Branch Elementary School, James F. Hennessey School, and School For Exceptional Studies.
Ownership History
Date
Name
Owned For
Owner Type
Purchase Details
Closed on
Sep 29, 1994
Sold by
Andover Bk
Bought by
Tarshi James M
Current Estimated Value
Home Financials for this Owner
Home Financials are based on the most recent Mortgage that was taken out on this home.
Original Mortgage
$59,900
Interest Rate
8.5%
Mortgage Type
Purchase Money Mortgage
Purchase Details
Closed on
Jun 26, 1987
Sold by
Lebel Gerard
Bought by
Larocque Jules J
Home Financials for this Owner
Home Financials are based on the most recent Mortgage that was taken out on this home.
Original Mortgage
$133,000
Interest Rate
10.5%
Mortgage Type
Purchase Money Mortgage
Create a Home Valuation Report for This Property
The Home Valuation Report is an in-depth analysis detailing your home's value as well as a comparison with similar homes in the area
Home Values in the Area
Average Home Value in this Area
Purchase History
| Date | Buyer | Sale Price | Title Company |
|---|---|---|---|
| Tarshi James M | $70,000 | -- | |
| Larocque Jules J | $180,000 | -- |
Source: Public Records
Mortgage History
| Date | Status | Borrower | Loan Amount |
|---|---|---|---|
| Closed | Larocque Jules J | $59,900 | |
| Previous Owner | Larocque Jules J | $133,000 |
Source: Public Records
Tax History Compared to Growth
Tax History
| Year | Tax Paid | Tax Assessment Tax Assessment Total Assessment is a certain percentage of the fair market value that is determined by local assessors to be the total taxable value of land and additions on the property. | Land | Improvement |
|---|---|---|---|---|
| 2025 | $5,193 | $590,100 | $137,900 | $452,200 |
| 2024 | $4,510 | $487,600 | $121,200 | $366,400 |
| 2023 | $4,424 | $435,400 | $110,300 | $325,100 |
| 2022 | $4,248 | $371,300 | $104,400 | $266,900 |
| 2021 | $4,733 | $385,700 | $104,400 | $281,300 |
| 2020 | $4,332 | $348,500 | $104,400 | $244,100 |
| 2019 | $4,163 | $304,300 | $81,900 | $222,400 |
| 2018 | $4,146 | $289,500 | $80,300 | $209,200 |
| 2017 | $3,800 | $247,700 | $73,900 | $173,800 |
| 2016 | $3,831 | $247,000 | $69,900 | $177,100 |
| 2015 | $3,760 | $248,700 | $69,900 | $178,800 |
Source: Public Records
Map
Nearby Homes
- 68 Wesley St
- 106 Leroy Ave
- 167 Ferry 53 Mann St Unit 2,5,6
- 262 E Haverhill St Unit 4
- 35 Kendall St
- 9 Boylston St
- 80 Ferry St Unit 80A
- 35 Swan Ave
- 29 Meadowbrook Rd
- 24 Boylston St
- 15 Swan Ave
- 24 Court St
- 100-102 E Haverhill St
- 3 Thissell St
- 65 Brook St
- 20 Knox St Unit 43
- 20 Knox St Unit 23
- 192 Union St
- 6 Brook St
- 1 Riverview Blvd Unit 3-8
- 73 Thornton St Unit 73
- 73 Thornton St
- 73 Thornton St Unit 1
- 75 Thornton St Unit 77
- 61 Wesley St
- 50 William St
- 60 Thornton St
- 79 Thornton St Unit 81
- 65 Wesley St
- 64 Thornton St
- 51 Thornton St
- 50 Thornton St
- 83 Thornton St Unit 85
- 83-85 Thornton St
- 66 Thornton St
- 69 Wesley St
- 49 Thornton St
- 68 Thorton St
- 55 Wesley St
- 68 Thornton St