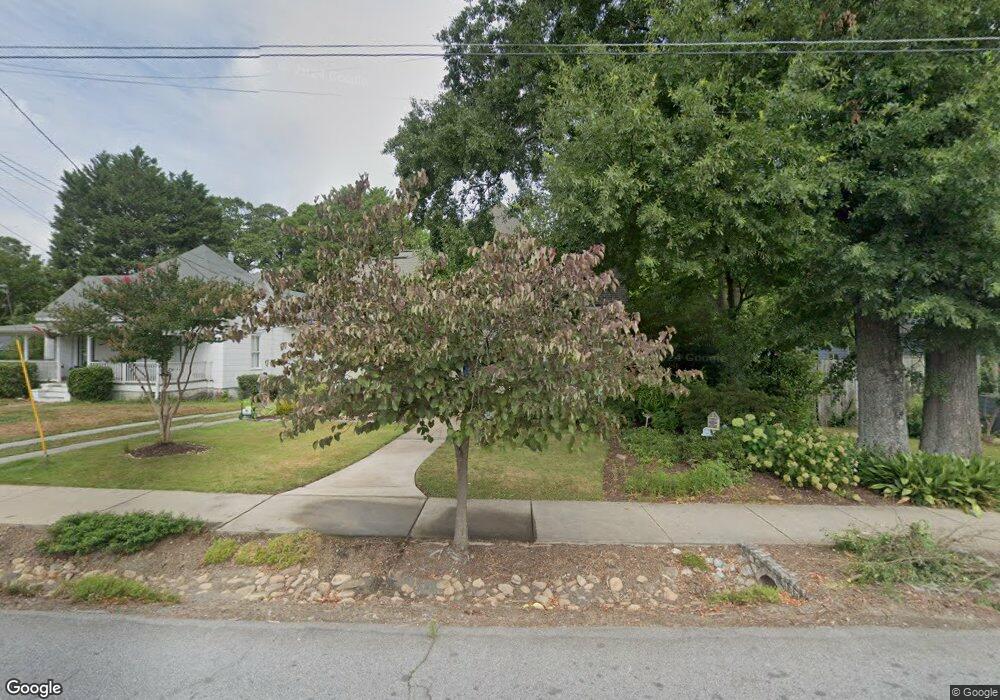
71 Thrasher St Norcross, GA 30071
Estimated Value: $672,706 - $967,000
4
Beds
4
Baths
2,314
Sq Ft
$365/Sq Ft
Est. Value
About This Home
This home is located at 71 Thrasher St, Norcross, GA 30071 and is currently estimated at $843,677, approximately $364 per square foot. 71 Thrasher St is a home located in Gwinnett County with nearby schools including Norcross Elementary School, Summerour Middle School, and Paul Duke STEM High School.
Ownership History
Date
Name
Owned For
Owner Type
Purchase Details
Closed on
Sep 6, 2019
Sold by
Mcclure Christine
Bought by
Bell Ronald J and Bell Susan
Current Estimated Value
Home Financials for this Owner
Home Financials are based on the most recent Mortgage that was taken out on this home.
Original Mortgage
$448,000
Outstanding Balance
$392,413
Interest Rate
3.6%
Mortgage Type
New Conventional
Estimated Equity
$451,264
Purchase Details
Closed on
May 15, 2019
Sold by
Mcclure Barbara K
Bought by
Mcclure Christine
Purchase Details
Closed on
Mar 29, 2019
Sold by
Mcclure Don E
Bought by
Mcclure Barbara K
Purchase Details
Closed on
Oct 28, 2004
Sold by
Allan John and Allan Anne
Bought by
Mcclure Don E
Home Financials for this Owner
Home Financials are based on the most recent Mortgage that was taken out on this home.
Original Mortgage
$275,000
Interest Rate
5.62%
Create a Home Valuation Report for This Property
The Home Valuation Report is an in-depth analysis detailing your home's value as well as a comparison with similar homes in the area
Home Values in the Area
Average Home Value in this Area
Purchase History
| Date | Buyer | Sale Price | Title Company |
|---|---|---|---|
| Bell Ronald J | $560,000 | -- | |
| Mcclure Christine | -- | -- | |
| Mcclure Barbara K | -- | -- | |
| Mcclure Don E | $175,000 | -- |
Source: Public Records
Mortgage History
| Date | Status | Borrower | Loan Amount |
|---|---|---|---|
| Open | Bell Ronald J | $448,000 | |
| Previous Owner | Mcclure Don E | $275,000 |
Source: Public Records
Tax History Compared to Growth
Tax History
| Year | Tax Paid | Tax Assessment Tax Assessment Total Assessment is a certain percentage of the fair market value that is determined by local assessors to be the total taxable value of land and additions on the property. | Land | Improvement |
|---|---|---|---|---|
| 2024 | $6,653 | $219,480 | $50,000 | $169,480 |
| 2023 | $6,653 | $236,000 | $37,600 | $198,400 |
| 2022 | $6,004 | $192,920 | $34,000 | $158,920 |
| 2021 | $6,485 | $203,520 | $28,800 | $174,720 |
| 2020 | $6,726 | $203,520 | $28,800 | $174,720 |
| 2019 | $3,204 | $112,440 | $20,000 | $92,440 |
| 2018 | $3,221 | $112,440 | $20,000 | $92,440 |
| 2016 | $2,809 | $84,960 | $20,000 | $64,960 |
| 2015 | $3,638 | $84,960 | $20,000 | $64,960 |
| 2014 | $1,263 | $37,440 | $8,000 | $29,440 |
Source: Public Records
Map
Nearby Homes
- 260 W Peachtree St
- 6026 Cushing Cir
- 370 Thrasher St Unit 2
- 5766 Buford Hwy
- 186 Wingo St
- 6065 Cushing Cir
- 5926 Redwine St
- 435 Webb Dr
- 5596 Buford Hwy
- 63 Born St NW
- 53AND63 Born St
- 6000 Hunter Hall Ct
- 53 Born St
- 5988 Eton Ct
- 5989 Kenn Manor Way
- 184 Hunter St
- 2918 Wild Laurel Ct
- 402 Summer Place
- 225 Valley Rd
- 71 Thrasher St NW
- 57 Thrasher St
- 87 Thrasher St
- 56 Holcomb Bridge Rd
- 39 Thrasher St
- 4 Holcomb Bridge Rd
- 4 Holcomb Bridge Rd
- 79 W Peachtree St
- 49 W Peachtree St
- 83 W Peachtree St
- 57R Holcomb Bridge Rd
- 8 Holcomb Bridge Rd
- 6 Holcomb Bridge Rd
- 2 Holcomb Bridge Rd
- 33 Holcomb Bridge Rd
- 57 Holcomb Bridge Rd
- 87 Holcomb Bridge Rd
- 97 Park Dr
- 90 W Peachtree St
- 0 Park Dr Unit 3162376