

71 Tupper Rd Sandwich, MA 02563
Estimated payment $6,388/month
About This Lot
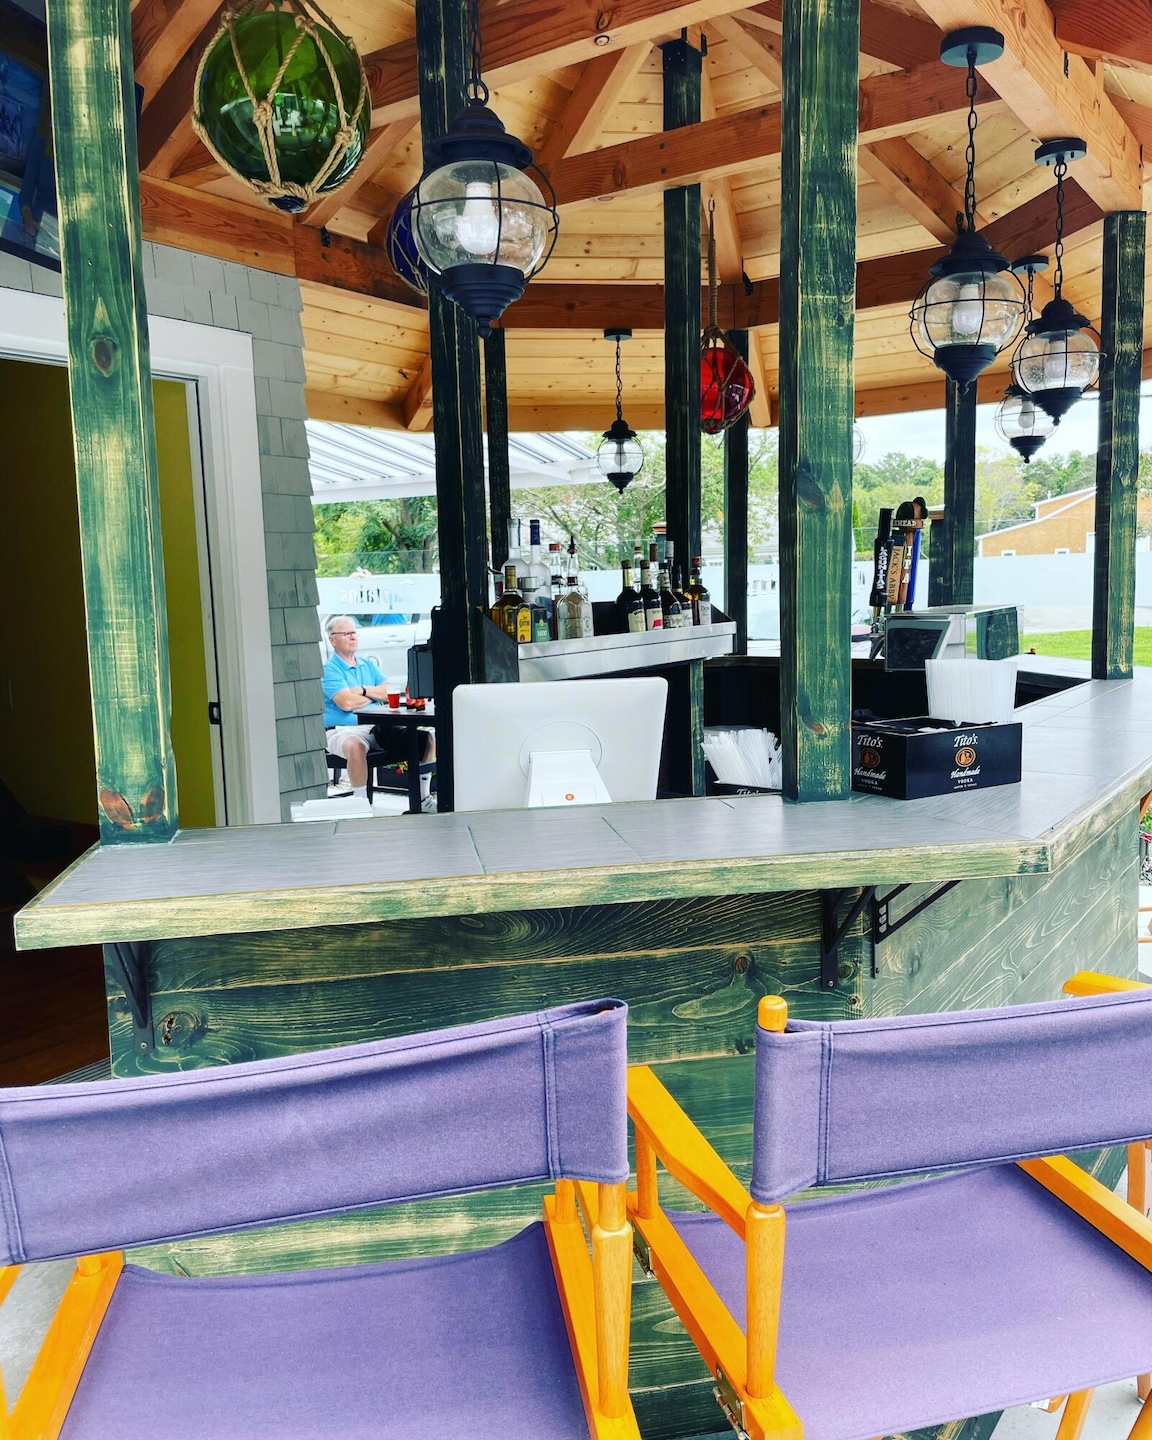
Buildable land well suited for Restaurant with Septic and active Liquor license ,but permitted for many other uses in BL1 . Large frontage on Tupper road .5 mile from very busy Marina District . BL1 Zoning With Flexible Permitted UsesActive Full-Year Liquor LicenseFully Operational Septic System (Title V1 Approved)As-Built Restaurant Plans Included With SaleFormer Captain's Seafood Goodwill and Name IncludedHigh-Traffic Area With Strong Year-Round ActivityLot Size: 0.68 acres | Zoning: Business Limited
Property Details
Property Type
- Land
Est. Annual Taxes
- $7,134
Lot Details
- 0.67 Acre Lot
- Level Lot
- Cleared Lot
- Property is zoned BL-1
Community Details
- No Home Owners Association
Listing and Financial Details
- Assessor Parcel Number SAND M:0087 B:0036
Map
Home Values in the Area
Average Home Value in this Area
Tax History
| Year | Tax Paid | Tax Assessment Tax Assessment Total Assessment is a certain percentage of the fair market value that is determined by local assessors to be the total taxable value of land and additions on the property. | Land | Improvement |
|---|---|---|---|---|
| 2025 | $7,134 | $674,900 | $318,000 | $356,900 |
| 2024 | $6,267 | $580,300 | $232,400 | $347,900 |
| 2023 | $5,741 | $499,200 | $223,500 | $275,700 |
| 2022 | $6,338 | $481,600 | $214,900 | $266,700 |
| 2021 | $6,491 | $471,400 | $206,600 | $264,800 |
| 2020 | $1,737 | $443,700 | $185,300 | $258,400 |
| 2019 | $6,142 | $428,900 | $179,900 | $249,000 |
| 2018 | $1,787 | $413,400 | $171,200 | $242,200 |
| 2017 | $1,740 | $394,000 | $170,500 | $223,500 |
| 2016 | $5,549 | $383,500 | $162,100 | $221,400 |
| 2015 | $5,457 | $368,200 | $149,500 | $218,700 |
Property History
| Date | Event | Price | List to Sale | Price per Sq Ft |
|---|---|---|---|---|
| 09/24/2025 09/24/25 | For Sale | $1,099,000 | -- | -- |
Purchase History
| Date | Type | Sale Price | Title Company |
|---|---|---|---|
| Deed | $325,000 | -- |
Mortgage History
| Date | Status | Loan Amount | Loan Type |
|---|---|---|---|
| Open | $239,000 | Commercial | |
| Closed | $300,000 | Commercial | |
| Closed | $250,000 | Commercial |
Source: Cape Cod & Islands Association of REALTORS®
MLS Number: 22504763
APN: SAND-000087-000036
Disclaimer: Certain information contained herein is derived from information provided by parties other than Homes.com. All information provided is deemed reliable, but is not guaranteed to be accurate and should be independently verified.
![]() All data relating to real estate for sale on this page comes from the Broker Reciprocity (BR) of the Cape Cod & Islands Multiple Listing Service, Inc. Detailed information about real estate listings held by brokerage firms other than CC&I Assoc. of REALTORS®, Inc. includes the name of the listing company. Neither the listing company nor CC&I Assoc. of REALTORS®, Inc. shall be responsible for any typographical errors, misinformation, misprints and shall be held totally harmless. The Broker providing this data believes it to be correct, but advises interested parties to confirm any item before relying on it in a purchase decision. All properties are subject to prior sale, changes, or withdrawal. Copyright 2025 © Cape Cod & Islands Multiple Listing Service, Inc. All rights reserved.
All data relating to real estate for sale on this page comes from the Broker Reciprocity (BR) of the Cape Cod & Islands Multiple Listing Service, Inc. Detailed information about real estate listings held by brokerage firms other than CC&I Assoc. of REALTORS®, Inc. includes the name of the listing company. Neither the listing company nor CC&I Assoc. of REALTORS®, Inc. shall be responsible for any typographical errors, misinformation, misprints and shall be held totally harmless. The Broker providing this data believes it to be correct, but advises interested parties to confirm any item before relying on it in a purchase decision. All properties are subject to prior sale, changes, or withdrawal. Copyright 2025 © Cape Cod & Islands Multiple Listing Service, Inc. All rights reserved.
- 118 Knott Ave
- 95 Main St Unit A
- 370 Phillips Rd
- 10 Clement St
- 334 Phillips Rd
- 65 Pleasant St Unit A
- 29 Williston Rd
- 372 Phillips Rd
- 81 Adams St
- 84 Mayflower Rd
- 208 Standish Rd Unit WINTER
- 422 Massachusetts 6a Unit 2
- 64 Cliffside Dr Unit Off Season
- 64 Cliffside Dr Unit 64
- 27 Ships View Terrace
- 619 White Cliff Dr
- 561 White Cliff Dr Unit Winter
- 561 White Cliff Dr Unit 561
- 18 Westcliff Dr
- 5 Anthonys Way
