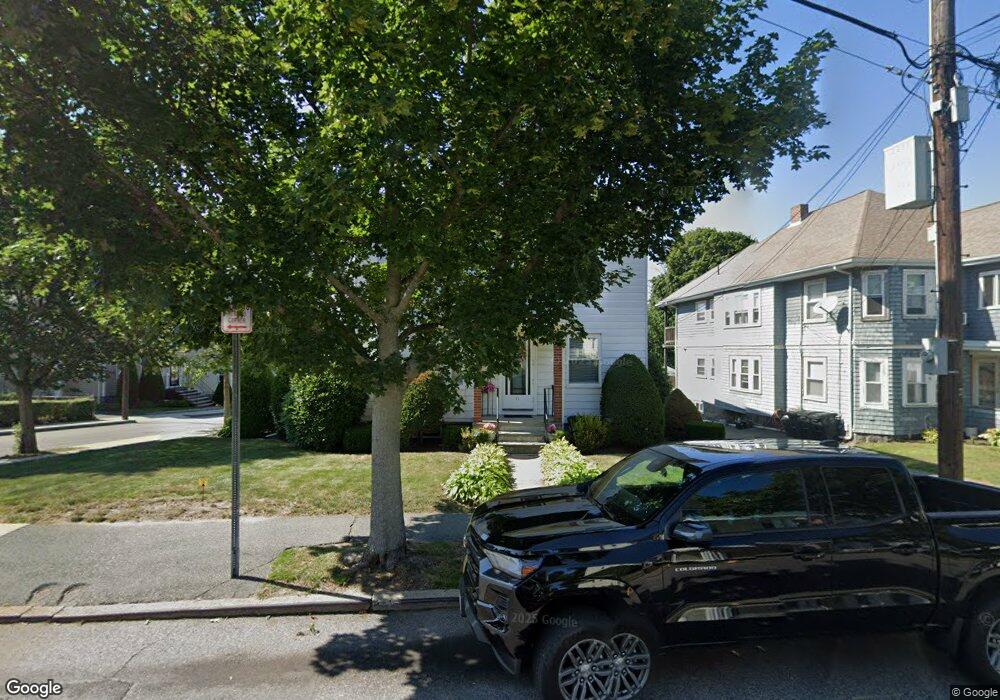
71 Verchild St Quincy, MA 02169
South Quincy NeighborhoodEstimated Value: $937,863 - $1,043,000
4
Beds
2
Baths
2,662
Sq Ft
$373/Sq Ft
Est. Value
About This Home
This home is located at 71 Verchild St, Quincy, MA 02169 and is currently estimated at $992,466, approximately $372 per square foot. 71 Verchild St is a home located in Norfolk County with nearby schools including Lincoln-Hancock Community School, South West Middle School, and Quincy High School.
Ownership History
Date
Name
Owned For
Owner Type
Purchase Details
Closed on
Aug 26, 2022
Sold by
Tiberi Imelda
Bought by
Imelda Tiberi Irt
Current Estimated Value
Purchase Details
Closed on
Jan 28, 1969
Bought by
Tiberi Ivan and Tiberi Imelda
Create a Home Valuation Report for This Property
The Home Valuation Report is an in-depth analysis detailing your home's value as well as a comparison with similar homes in the area
Home Values in the Area
Average Home Value in this Area
Purchase History
| Date | Buyer | Sale Price | Title Company |
|---|---|---|---|
| Imelda Tiberi Irt | -- | None Available | |
| Tiberi Ivan | -- | -- |
Source: Public Records
Mortgage History
| Date | Status | Borrower | Loan Amount |
|---|---|---|---|
| Previous Owner | Tiberi Ivan | $30,000 | |
| Previous Owner | Tiberi Ivan | $30,000 | |
| Previous Owner | Tiberi Ivan | $3,780 |
Source: Public Records
Tax History Compared to Growth
Tax History
| Year | Tax Paid | Tax Assessment Tax Assessment Total Assessment is a certain percentage of the fair market value that is determined by local assessors to be the total taxable value of land and additions on the property. | Land | Improvement |
|---|---|---|---|---|
| 2025 | $9,682 | $839,700 | $296,600 | $543,100 |
| 2024 | $9,133 | $810,400 | $282,500 | $527,900 |
| 2023 | $8,734 | $784,700 | $256,800 | $527,900 |
| 2022 | $8,784 | $733,200 | $214,000 | $519,200 |
| 2021 | $8,273 | $681,500 | $214,000 | $467,500 |
| 2020 | $8,696 | $699,600 | $214,000 | $485,600 |
| 2019 | $7,638 | $608,600 | $201,900 | $406,700 |
| 2018 | $7,624 | $571,500 | $187,000 | $384,500 |
| 2017 | $7,874 | $555,700 | $178,000 | $377,700 |
| 2016 | $6,850 | $477,000 | $154,800 | $322,200 |
| 2015 | $6,615 | $453,100 | $154,800 | $298,300 |
| 2014 | $5,641 | $379,600 | $154,800 | $224,800 |
Source: Public Records
Map
Nearby Homes
- 192 Federal Ave Unit B
- 52 Norman Rd
- 72 Federal Ave
- 10 Hughes St
- 195 Independence Ave Unit 137
- 218 Independence Ave Unit B
- 83 Madison Ave
- 155 Kendrick Ave Unit T7
- 166 Phipps St
- 347 Centre St
- 102 Conrad St
- 8 Jackson St Unit B2
- 161 Cedar St
- 106 Home Park Rd
- 21 Totman St Unit 204
- 21 Totman St Unit 202
- 21 Totman St Unit 309
- 21 Totman St Unit 306
- 21 Totman St Unit 410
- 21 Totman St Unit Model-1
- 38 Plymouth St Unit 1
- 65 Verchild St
- 26 Plymouth St
- 26 Plymouth St Unit 2
- 31 Plymouth St
- 61 Verchild St
- 63 Verchild St
- 63 Verchild St Unit 1
- 61 Verchild St Unit 1
- 61 Verchild St Unit 3
- 79 Verchild St
- 72 Verchild St
- 72 Verchild St Unit 2
- 25 Plymouth St
- 22 Plymouth St
- 22 Plymouth St
- 55 Verchild St
- 62 Verchild St
- 62 Verchild St Unit 62
- 62 Verchild St Unit 64