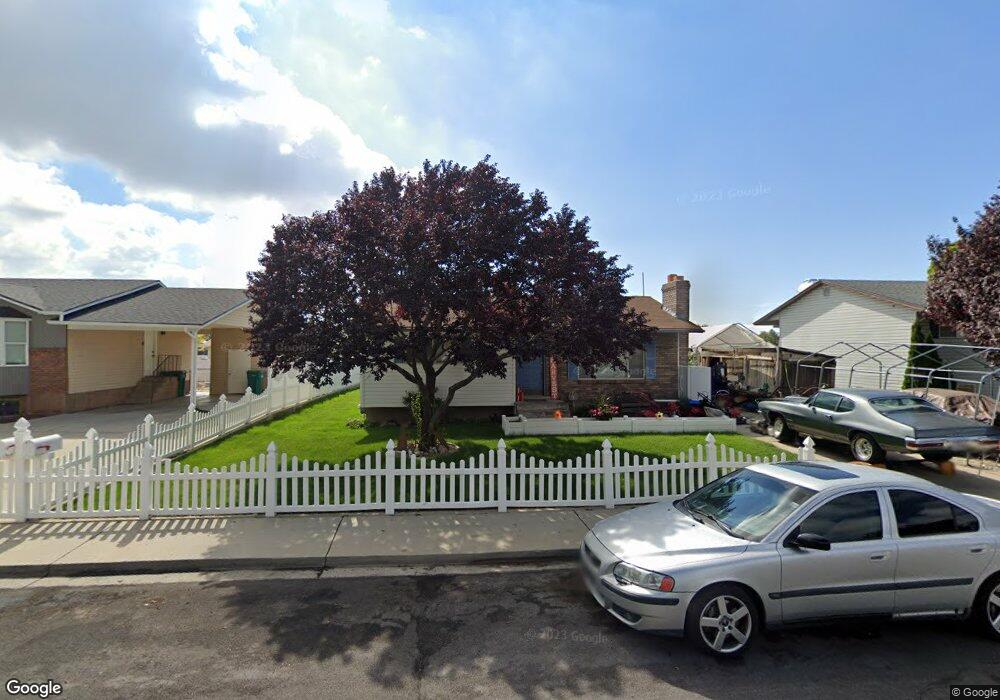
71 W 220 S Orem, UT 84058
Orem Park NeighborhoodEstimated Value: $450,825 - $519,000
3
Beds
2
Baths
1,284
Sq Ft
$370/Sq Ft
Est. Value
About This Home
This home is located at 71 W 220 S, Orem, UT 84058 and is currently estimated at $474,608, approximately $369 per square foot. 71 W 220 S is a home located in Utah County with nearby schools including Orem Elementary School, Orem Junior High School, and Mountain View High School.
Ownership History
Date
Name
Owned For
Owner Type
Purchase Details
Closed on
Jan 15, 2021
Sold by
Stites Jeremy E and Stites Jennfier C
Bought by
Stites Jennifer C and Stites Jeremy E
Current Estimated Value
Home Financials for this Owner
Home Financials are based on the most recent Mortgage that was taken out on this home.
Original Mortgage
$175,000
Outstanding Balance
$142,088
Interest Rate
2.67%
Mortgage Type
New Conventional
Estimated Equity
$332,520
Purchase Details
Closed on
Aug 25, 2005
Sold by
Mitchell Glenn E and Mitchell Christine R
Bought by
Stites Jeremy E and Stites Jennifer C
Create a Home Valuation Report for This Property
The Home Valuation Report is an in-depth analysis detailing your home's value as well as a comparison with similar homes in the area
Home Values in the Area
Average Home Value in this Area
Purchase History
| Date | Buyer | Sale Price | Title Company |
|---|---|---|---|
| Stites Jennifer C | -- | Inwest Title | |
| Stites Jeremy E | -- | Horizon Title Insurance |
Source: Public Records
Mortgage History
| Date | Status | Borrower | Loan Amount |
|---|---|---|---|
| Open | Stites Jennifer C | $175,000 |
Source: Public Records
Tax History
| Year | Tax Paid | Tax Assessment Tax Assessment Total Assessment is a certain percentage of the fair market value that is determined by local assessors to be the total taxable value of land and additions on the property. | Land | Improvement |
|---|---|---|---|---|
| 2025 | $1,754 | $217,855 | -- | -- |
| 2024 | $1,754 | $214,445 | $0 | $0 |
| 2023 | $1,641 | $215,600 | $0 | $0 |
| 2022 | $1,629 | $207,405 | $0 | $0 |
| 2021 | $1,514 | $292,000 | $165,000 | $127,000 |
| 2020 | $1,353 | $256,500 | $132,000 | $124,500 |
| 2019 | $1,250 | $246,400 | $121,900 | $124,500 |
| 2018 | $1,165 | $219,300 | $105,000 | $114,300 |
| 2017 | $1,103 | $111,265 | $0 | $0 |
| 2016 | $1,039 | $96,690 | $0 | $0 |
| 2015 | $1,075 | $94,600 | $0 | $0 |
| 2014 | $1,061 | $92,895 | $0 | $0 |
Source: Public Records
Map
Nearby Homes
Your Personal Tour Guide
Ask me questions while you tour the home.