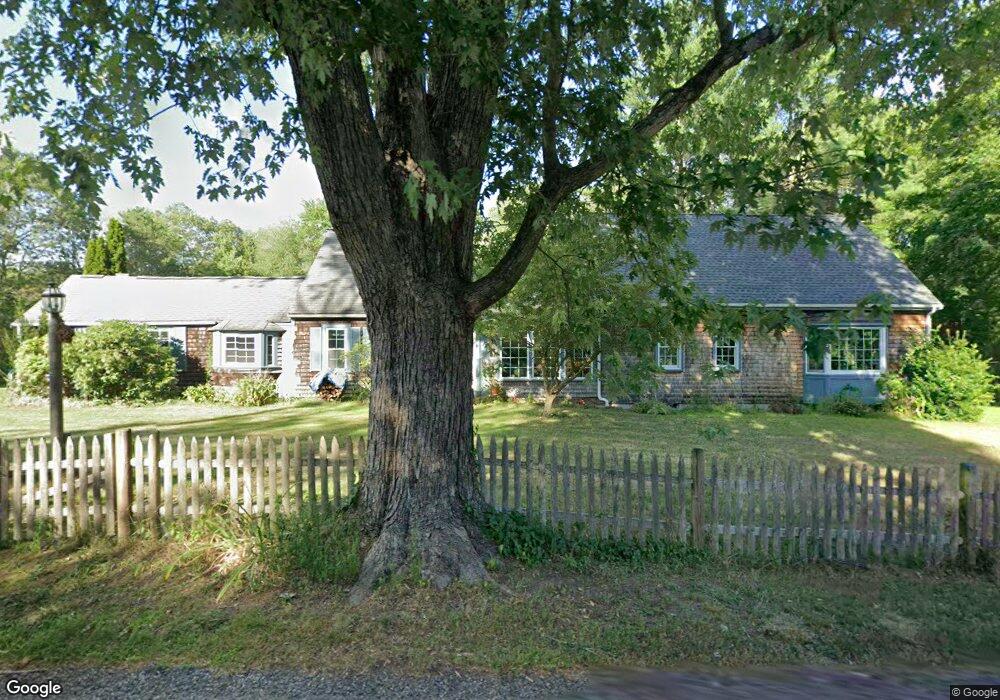
71 Warren St Plainville, MA 02762
Estimated Value: $670,889 - $757,000
3
Beds
2
Baths
2,129
Sq Ft
$334/Sq Ft
Est. Value
About This Home
This home is located at 71 Warren St, Plainville, MA 02762 and is currently estimated at $710,972, approximately $333 per square foot. 71 Warren St is a home located in Norfolk County with nearby schools including Anna Ware Jackson School and Beatrice H. Wood Elementary School.
Ownership History
Date
Name
Owned For
Owner Type
Purchase Details
Closed on
Jan 21, 2025
Sold by
Graham Paul J and Graham Cheryl L
Bought by
Paul L Graham Ret and Graham
Current Estimated Value
Purchase Details
Closed on
May 25, 1994
Sold by
Johnson Matthew J and Johnson Noreen A
Bought by
Clark Cheryl
Home Financials for this Owner
Home Financials are based on the most recent Mortgage that was taken out on this home.
Original Mortgage
$136,000
Interest Rate
8.22%
Mortgage Type
Purchase Money Mortgage
Purchase Details
Closed on
Jul 15, 1988
Sold by
Odconnell Cary J
Bought by
Johnson Matthew J
Create a Home Valuation Report for This Property
The Home Valuation Report is an in-depth analysis detailing your home's value as well as a comparison with similar homes in the area
Home Values in the Area
Average Home Value in this Area
Purchase History
| Date | Buyer | Sale Price | Title Company |
|---|---|---|---|
| Paul L Graham Ret | -- | None Available | |
| Paul L Graham Ret | -- | None Available | |
| Clark Cheryl | $170,000 | -- | |
| Clark Cheryl | $170,000 | -- | |
| Johnson Matthew J | $177,000 | -- |
Source: Public Records
Mortgage History
| Date | Status | Borrower | Loan Amount |
|---|---|---|---|
| Previous Owner | Johnson Matthew J | $142,200 | |
| Previous Owner | Johnson Matthew J | $136,000 | |
| Previous Owner | Johnson Matthew J | $128,000 |
Source: Public Records
Tax History Compared to Growth
Tax History
| Year | Tax Paid | Tax Assessment Tax Assessment Total Assessment is a certain percentage of the fair market value that is determined by local assessors to be the total taxable value of land and additions on the property. | Land | Improvement |
|---|---|---|---|---|
| 2025 | $6,623 | $572,900 | $259,200 | $313,700 |
| 2024 | $6,272 | $522,700 | $237,300 | $285,400 |
| 2023 | $6,024 | $482,700 | $237,300 | $245,400 |
| 2022 | $6,217 | $443,100 | $229,100 | $214,000 |
| 2021 | $6,080 | $413,600 | $229,100 | $184,500 |
| 2020 | $6,258 | $425,700 | $229,100 | $196,600 |
| 2019 | $5,713 | $381,600 | $219,100 | $162,500 |
| 2018 | $5,666 | $376,200 | $209,000 | $167,200 |
| 2017 | $5,364 | $357,600 | $218,600 | $139,000 |
| 2016 | $5,061 | $341,300 | $218,600 | $122,700 |
| 2015 | $4,623 | $299,800 | $183,300 | $116,500 |
| 2014 | $4,166 | $278,500 | $183,300 | $95,200 |
Source: Public Records
Map
Nearby Homes