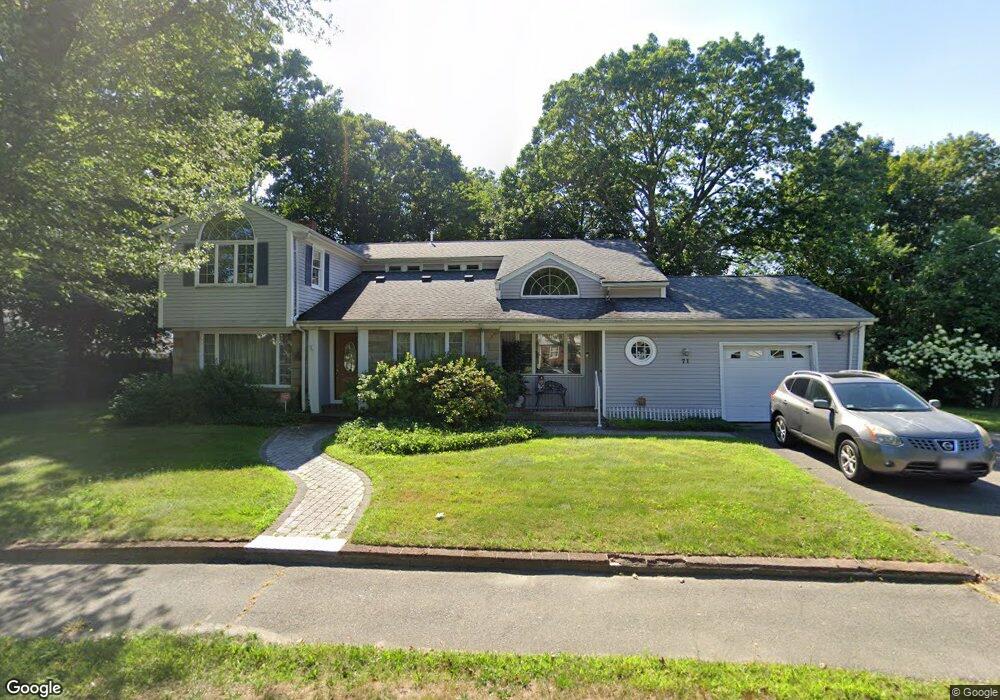
71 West St Brockton, MA 02301
Winters Corner NeighborhoodEstimated Value: $630,146 - $768,000
4
Beds
4
Baths
2,549
Sq Ft
$274/Sq Ft
Est. Value
About This Home
This home is located at 71 West St, Brockton, MA 02301 and is currently estimated at $697,787, approximately $273 per square foot. 71 West St is a home located in Plymouth County with nearby schools including Manthala George Jr. School, Hancock Elementary School, and Louis F Angelo Elementary School.
Ownership History
Date
Name
Owned For
Owner Type
Purchase Details
Closed on
May 22, 1997
Sold by
Francisco Candida F and Glenn Elizabeth
Bought by
Kahn Eric A and Kahn Cecilia W
Current Estimated Value
Home Financials for this Owner
Home Financials are based on the most recent Mortgage that was taken out on this home.
Original Mortgage
$115,000
Interest Rate
8.08%
Mortgage Type
Purchase Money Mortgage
Create a Home Valuation Report for This Property
The Home Valuation Report is an in-depth analysis detailing your home's value as well as a comparison with similar homes in the area
Home Values in the Area
Average Home Value in this Area
Purchase History
| Date | Buyer | Sale Price | Title Company |
|---|---|---|---|
| Kahn Eric A | $165,000 | -- |
Source: Public Records
Mortgage History
| Date | Status | Borrower | Loan Amount |
|---|---|---|---|
| Open | Kahn Eric A | $50,000 | |
| Open | Kahn Eric A | $108,000 | |
| Closed | Kahn Eric A | $113,000 | |
| Closed | Kahn Eric A | $115,000 |
Source: Public Records
Tax History Compared to Growth
Tax History
| Year | Tax Paid | Tax Assessment Tax Assessment Total Assessment is a certain percentage of the fair market value that is determined by local assessors to be the total taxable value of land and additions on the property. | Land | Improvement |
|---|---|---|---|---|
| 2025 | $5,878 | $485,400 | $149,400 | $336,000 |
| 2024 | $5,732 | $476,900 | $149,400 | $327,500 |
| 2023 | $5,554 | $427,900 | $114,700 | $313,200 |
| 2022 | $5,251 | $375,900 | $104,400 | $271,500 |
| 2021 | $5,059 | $348,900 | $97,800 | $251,100 |
| 2020 | $5,580 | $368,300 | $93,700 | $274,600 |
| 2019 | $5,385 | $346,500 | $87,800 | $258,700 |
| 2018 | $4,871 | $303,300 | $87,800 | $215,500 |
| 2017 | $4,703 | $292,100 | $87,800 | $204,300 |
| 2016 | $5,428 | $312,700 | $83,900 | $228,800 |
| 2015 | $5,138 | $283,100 | $83,900 | $199,200 |
| 2014 | $4,973 | $274,300 | $83,900 | $190,400 |
Source: Public Records
Map
Nearby Homes
- 28 Fern Ave
- 37 West St
- 25 Monson St
- 48 N Belcher Ave
- 20 Montauk Rd
- 17 Moraine Place
- 21 Oneida Ave
- 67 Sycamore Ave Unit 3
- 72 W Elm Terrace
- 161 Moraine St
- 77 Colonel Bell Dr Unit 4
- 78 Keene St
- 45 Briarcliff Rd
- 61 Fairfield St
- 141 Prospect Ave
- 175 Belmont Ave
- 15 Byron Ave
- 281 Spring St
- 190 Highland St
- 114 Crickett Rd