Estimated Value: $406,032 - $453,000
3
Beds
2
Baths
1,359
Sq Ft
$315/Sq Ft
Est. Value
About This Home
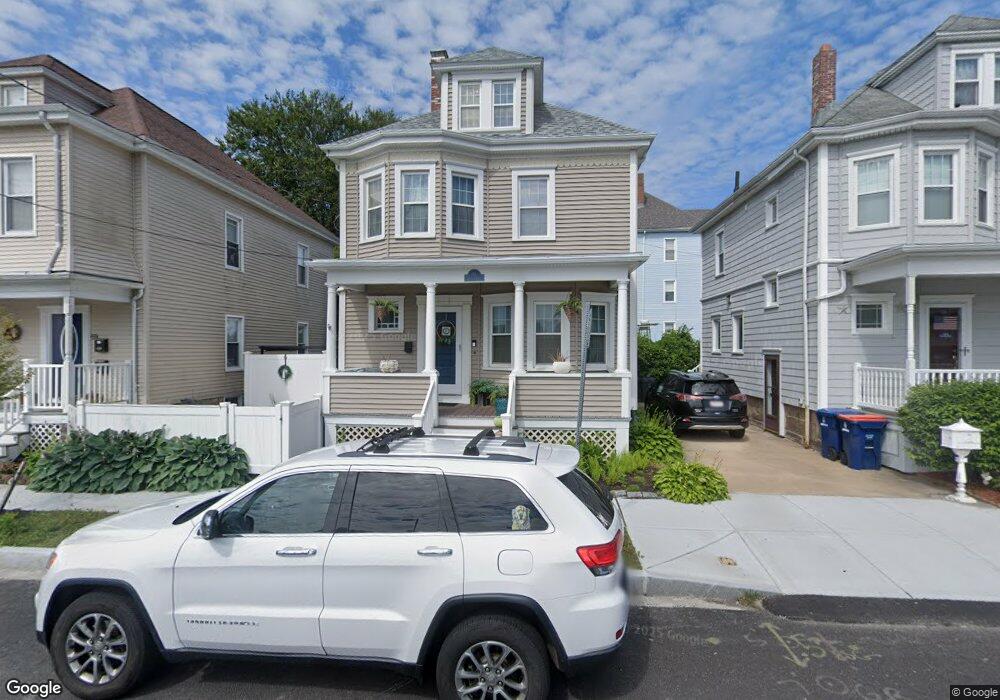
This home is located at 71 West St, New Bedford, MA 02740 and is currently estimated at $428,758, approximately $315 per square foot. 71 West St is a home located in Bristol County with nearby schools including Betsey B. Winslow Elementary School, Keith Middle School, and New Bedford High School.
Ownership History
Date
Name
Owned For
Owner Type
Purchase Details
Closed on
Mar 23, 2007
Sold by
Lee John J and Lee Joyce M
Bought by
Parker Katherine S
Current Estimated Value
Home Financials for this Owner
Home Financials are based on the most recent Mortgage that was taken out on this home.
Original Mortgage
$166,400
Outstanding Balance
$101,105
Interest Rate
6.33%
Mortgage Type
Purchase Money Mortgage
Estimated Equity
$327,653
Purchase Details
Closed on
Jun 10, 2005
Sold by
Vieira Michael and Vieira Michelle A
Bought by
Lee John J and Lee Joyce M
Purchase Details
Closed on
Dec 30, 1999
Sold by
Costa Leonard J and Costa Marilyn A
Bought by
Vieira Michael and Vieira Michelle A
Purchase Details
Closed on
May 21, 1996
Sold by
Libbey Richard L C
Bought by
Costa Leonard J and Costa Marilyn A
Create a Home Valuation Report for This Property
The Home Valuation Report is an in-depth analysis detailing your home's value as well as a comparison with similar homes in the area
Home Values in the Area
Average Home Value in this Area
Purchase History
| Date | Buyer | Sale Price | Title Company |
|---|---|---|---|
| Parker Katherine S | $208,000 | -- | |
| Parker Katherine S | $208,000 | -- | |
| Lee John J | $242,500 | -- | |
| Lee John J | $242,500 | -- | |
| Vieira Michael | $78,000 | -- | |
| Vieira Michael | $78,000 | -- | |
| Costa Leonard J | $67,000 | -- | |
| Costa Leonard J | $67,000 | -- |
Source: Public Records
Mortgage History
| Date | Status | Borrower | Loan Amount |
|---|---|---|---|
| Open | Costa Leonard J | $166,400 | |
| Closed | Costa Leonard J | $166,400 |
Source: Public Records
Tax History Compared to Growth
Tax History
| Year | Tax Paid | Tax Assessment Tax Assessment Total Assessment is a certain percentage of the fair market value that is determined by local assessors to be the total taxable value of land and additions on the property. | Land | Improvement |
|---|---|---|---|---|
| 2025 | $3,609 | $319,100 | $88,600 | $230,500 |
| 2024 | $3,529 | $294,100 | $90,000 | $204,100 |
| 2023 | $3,845 | $269,100 | $77,600 | $191,500 |
| 2022 | $3,428 | $220,600 | $73,800 | $146,800 |
| 2021 | $3,294 | $211,300 | $73,800 | $137,500 |
| 2020 | $3,138 | $194,200 | $73,800 | $120,400 |
| 2019 | $3,011 | $182,800 | $73,800 | $109,000 |
| 2018 | $2,799 | $168,300 | $73,800 | $94,500 |
| 2017 | $2,700 | $161,800 | $73,800 | $88,000 |
| 2016 | $2,610 | $158,300 | $73,800 | $84,500 |
| 2015 | $2,457 | $156,200 | $73,800 | $82,400 |
| 2014 | $2,295 | $151,400 | $69,400 | $82,000 |
Source: Public Records
Map
Nearby Homes