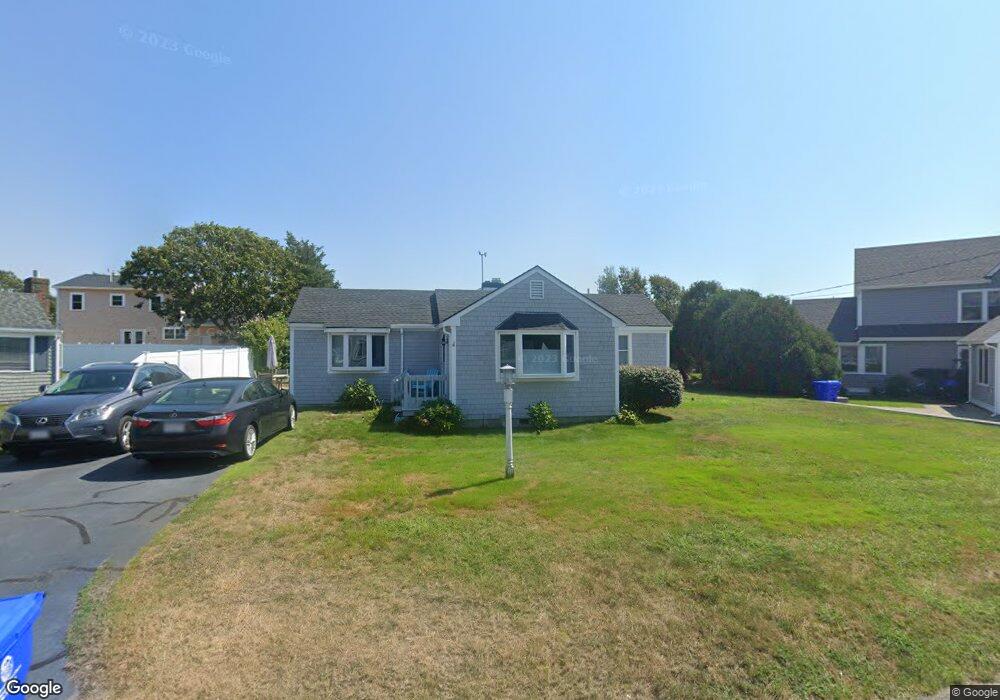
71 Wianno Rd Bourne, MA 02532
Estimated Value: $736,000 - $974,000
2
Beds
1
Bath
1,306
Sq Ft
$646/Sq Ft
Est. Value
About This Home
This home is located at 71 Wianno Rd, Bourne, MA 02532 and is currently estimated at $844,251, approximately $646 per square foot. 71 Wianno Rd is a home located in Barnstable County with nearby schools including Bourne High School.
Ownership History
Date
Name
Owned For
Owner Type
Purchase Details
Closed on
Oct 30, 2024
Sold by
Asquith Kerry T
Bought by
Kerry Asquith 2024 T and Kerry Asquith
Current Estimated Value
Purchase Details
Closed on
Mar 12, 1998
Sold by
71 Wianno Rd Rt and Asquith Edith C
Bought by
Asquith Kerry T and Harvey-Asquith Jillian
Home Financials for this Owner
Home Financials are based on the most recent Mortgage that was taken out on this home.
Original Mortgage
$124,000
Interest Rate
7.03%
Mortgage Type
Purchase Money Mortgage
Create a Home Valuation Report for This Property
The Home Valuation Report is an in-depth analysis detailing your home's value as well as a comparison with similar homes in the area
Home Values in the Area
Average Home Value in this Area
Purchase History
| Date | Buyer | Sale Price | Title Company |
|---|---|---|---|
| Kerry Asquith 2024 T | -- | None Available | |
| Kerry Asquith 2024 T | -- | None Available | |
| Kerry Asquith 2024 T | -- | None Available | |
| Asquith Kerry T | $155,000 | -- | |
| Asquith Kerry T | $155,000 | -- |
Source: Public Records
Mortgage History
| Date | Status | Borrower | Loan Amount |
|---|---|---|---|
| Previous Owner | Asquith Kerry T | $124,000 |
Source: Public Records
Tax History Compared to Growth
Tax History
| Year | Tax Paid | Tax Assessment Tax Assessment Total Assessment is a certain percentage of the fair market value that is determined by local assessors to be the total taxable value of land and additions on the property. | Land | Improvement |
|---|---|---|---|---|
| 2025 | $5,955 | $762,500 | $523,500 | $239,000 |
| 2024 | $5,823 | $726,100 | $498,500 | $227,600 |
| 2023 | $5,661 | $642,600 | $441,200 | $201,400 |
| 2022 | $4,854 | $481,100 | $325,400 | $155,700 |
| 2021 | $4,715 | $437,800 | $296,100 | $141,700 |
| 2020 | $4,599 | $428,200 | $293,300 | $134,900 |
| 2019 | $4,421 | $420,600 | $293,300 | $127,300 |
| 2018 | $2,627 | $394,500 | $279,400 | $115,100 |
| 2017 | $4,366 | $423,900 | $309,900 | $114,000 |
| 2016 | $4,078 | $401,400 | $309,900 | $91,500 |
| 2015 | $4,545 | $451,300 | $359,800 | $91,500 |
Source: Public Records
Map
Nearby Homes