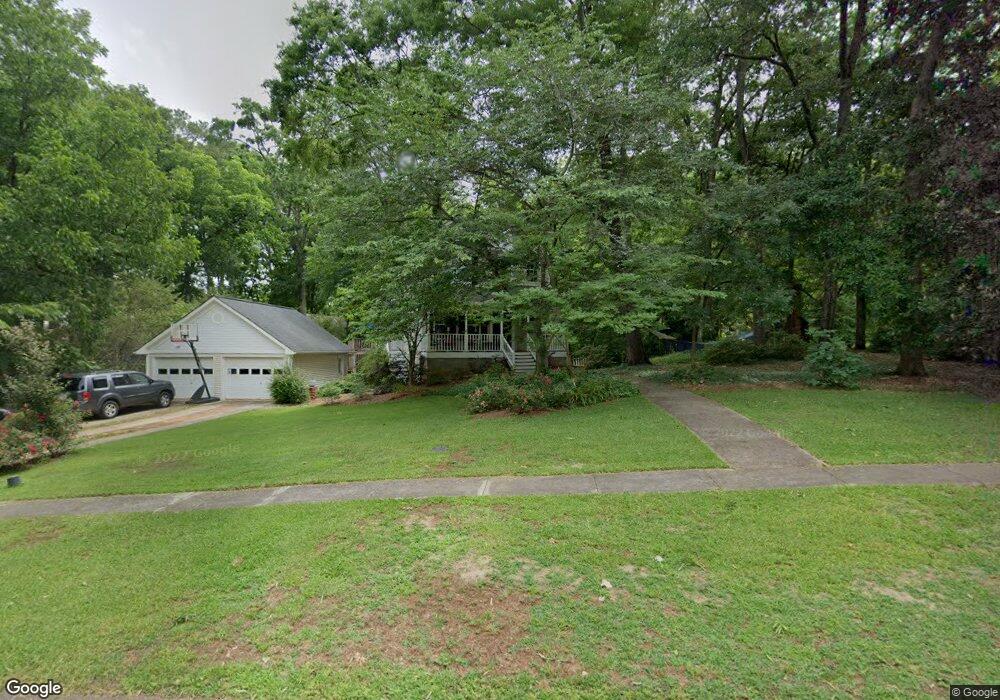
71 Willow Dell Dr Senoia, GA 30276
Estimated Value: $402,000 - $508,421
3
Beds
2
Baths
2,154
Sq Ft
$214/Sq Ft
Est. Value
About This Home
This home is located at 71 Willow Dell Dr, Senoia, GA 30276 and is currently estimated at $460,855, approximately $213 per square foot. 71 Willow Dell Dr is a home located in Coweta County with nearby schools including Eastside Elementary School, East Coweta Middle School, and East Coweta High School.
Ownership History
Date
Name
Owned For
Owner Type
Purchase Details
Closed on
Jul 3, 1997
Sold by
Tucker Federal Bank
Bought by
Pogue D Alan and Pogue Kimberlee H
Current Estimated Value
Home Financials for this Owner
Home Financials are based on the most recent Mortgage that was taken out on this home.
Original Mortgage
$101,650
Outstanding Balance
$15,189
Interest Rate
7.98%
Mortgage Type
New Conventional
Estimated Equity
$445,666
Purchase Details
Closed on
May 6, 1997
Bought by
Tucker Federal Bank
Home Financials for this Owner
Home Financials are based on the most recent Mortgage that was taken out on this home.
Original Mortgage
$101,650
Outstanding Balance
$15,189
Interest Rate
7.98%
Mortgage Type
New Conventional
Estimated Equity
$445,666
Purchase Details
Closed on
Mar 31, 1995
Bought by
Sherrel John B
Purchase Details
Closed on
Sep 30, 1990
Bought by
Freeman Limited
Purchase Details
Closed on
Aug 1, 1989
Bought by
Freeman Frances M
Create a Home Valuation Report for This Property
The Home Valuation Report is an in-depth analysis detailing your home's value as well as a comparison with similar homes in the area
Home Values in the Area
Average Home Value in this Area
Purchase History
| Date | Buyer | Sale Price | Title Company |
|---|---|---|---|
| Pogue D Alan | $107,000 | -- | |
| Tucker Federal Bank | $102,000 | -- | |
| Sherrel John B | $300,000 | -- | |
| Freeman Limited | -- | -- | |
| Freeman Frances M | $152,900 | -- |
Source: Public Records
Mortgage History
| Date | Status | Borrower | Loan Amount |
|---|---|---|---|
| Open | Pogue D Alan | $101,650 |
Source: Public Records
Tax History Compared to Growth
Tax History
| Year | Tax Paid | Tax Assessment Tax Assessment Total Assessment is a certain percentage of the fair market value that is determined by local assessors to be the total taxable value of land and additions on the property. | Land | Improvement |
|---|---|---|---|---|
| 2024 | $4,682 | $172,260 | $32,000 | $140,260 |
| 2023 | $4,682 | $144,497 | $26,000 | $118,497 |
| 2022 | $3,540 | $125,095 | $26,000 | $99,095 |
| 2021 | $3,304 | $108,312 | $30,000 | $78,312 |
| 2020 | $2,924 | $111,406 | $30,000 | $81,406 |
| 2019 | $3,151 | $92,394 | $16,000 | $76,394 |
| 2018 | $3,168 | $92,394 | $16,000 | $76,394 |
| 2017 | $2,777 | $81,095 | $10,000 | $71,095 |
| 2016 | $2,583 | $75,797 | $10,000 | $65,797 |
| 2015 | $2,171 | $65,199 | $10,000 | $55,199 |
| 2014 | $2,194 | $65,199 | $10,000 | $55,199 |
Source: Public Records
Map
Nearby Homes
- 44 Standing Rock Rd
- 0 Johnson St Unit 10612656
- 71 Lower Creek Trail
- 260 Willow Dell Dr
- 271 Bridge St
- 35 Millwalk Dr
- 103 Morgan St
- 126 Morgan St
- 124 Morgan St
- 146 Middle St
- 0 Coweta St Unit 10555038
- 351 Seavy St
- 316 Hammerstone Ct Unit 19
- 0 Quick Dr Unit 10555827
- 220 Johnson St
- 46 Horseshoe Bend Way
- 140 Southridge
- 245 South Ridge
- 42 Piedmont Dr
- 230 Southridge
- 89 Willow Dell Dr
- 64 Willow Dell Dr
- 39 Willow Dell Dr
- 74 Willow Dell Dr
- 48 Willow Dell Dr
- 78 Turin Rd
- 30 Turin St
- 96 Willow Dell Dr
- 101 Willow Dell Dr
- 34 Willow Dell Dr Unit 1A
- 0 Turin St Unit 7160326
- 0 Turin St Unit 8282915
- 0 Turin St Unit 8283876
- 0 Turin St Unit 8234638
- 0 Turin St Unit 3258837
- 0 Turin St
- 120 Turin St
- 77 Turin St
- 110 Willow Dell Dr
- 430 Pylant St