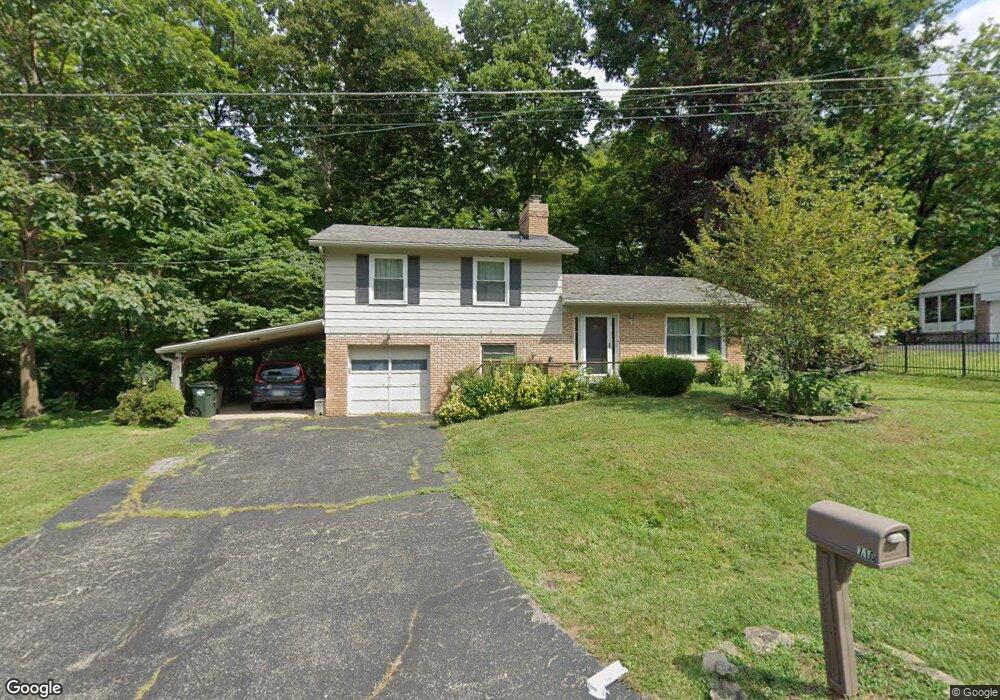
710 Beechwood Ln Milford, OH 45150
Estimated Value: $262,280 - $309,000
3
Beds
2
Baths
1,056
Sq Ft
$269/Sq Ft
Est. Value
About This Home
This home is located at 710 Beechwood Ln, Milford, OH 45150 and is currently estimated at $284,320, approximately $269 per square foot. 710 Beechwood Ln is a home located in Clermont County with nearby schools including Milford Senior High School, St. Andrew - St. Elizabeth Ann Seton School, and St. Mark's Lutheran School.
Ownership History
Date
Name
Owned For
Owner Type
Purchase Details
Closed on
Aug 9, 1999
Sold by
Roberts Bradley W
Bought by
Beutner Marianne
Current Estimated Value
Home Financials for this Owner
Home Financials are based on the most recent Mortgage that was taken out on this home.
Original Mortgage
$96,900
Outstanding Balance
$27,911
Interest Rate
7.68%
Mortgage Type
New Conventional
Estimated Equity
$256,409
Purchase Details
Closed on
Dec 29, 1995
Sold by
Orewiler Sheila
Bought by
Roberts Bradley and Roberts Sharon
Home Financials for this Owner
Home Financials are based on the most recent Mortgage that was taken out on this home.
Original Mortgage
$88,638
Interest Rate
7.88%
Mortgage Type
VA
Purchase Details
Closed on
Jul 16, 1992
Purchase Details
Closed on
Aug 1, 1988
Create a Home Valuation Report for This Property
The Home Valuation Report is an in-depth analysis detailing your home's value as well as a comparison with similar homes in the area
Home Values in the Area
Average Home Value in this Area
Purchase History
| Date | Buyer | Sale Price | Title Company |
|---|---|---|---|
| Beutner Marianne | $102,000 | -- | |
| Roberts Bradley | $86,900 | -- | |
| -- | $75,900 | -- | |
| -- | $68,000 | -- |
Source: Public Records
Mortgage History
| Date | Status | Borrower | Loan Amount |
|---|---|---|---|
| Open | Beutner Marianne | $96,900 | |
| Previous Owner | Roberts Bradley | $88,638 |
Source: Public Records
Tax History Compared to Growth
Tax History
| Year | Tax Paid | Tax Assessment Tax Assessment Total Assessment is a certain percentage of the fair market value that is determined by local assessors to be the total taxable value of land and additions on the property. | Land | Improvement |
|---|---|---|---|---|
| 2024 | $2,912 | $73,710 | $19,740 | $53,970 |
| 2023 | $2,971 | $73,710 | $19,740 | $53,970 |
| 2022 | $3,322 | $54,950 | $14,700 | $40,250 |
| 2021 | $3,326 | $54,950 | $14,700 | $40,250 |
| 2020 | $3,188 | $54,950 | $14,700 | $40,250 |
| 2019 | $2,689 | $42,880 | $12,710 | $30,170 |
| 2018 | $2,690 | $42,880 | $12,710 | $30,170 |
| 2017 | $2,444 | $42,880 | $12,710 | $30,170 |
| 2016 | $2,444 | $35,420 | $10,500 | $24,920 |
| 2015 | $2,284 | $35,420 | $10,500 | $24,920 |
| 2014 | $2,284 | $35,420 | $10,500 | $24,920 |
| 2013 | $2,425 | $36,470 | $12,250 | $24,220 |
Source: Public Records
Map
Nearby Homes
- 732 St Rt 28
- 5763 Price Rd
- 5633 Happy Hollow Rd
- 826 Ohio 131
- 18 Big Oak Ln
- 5 White Water Way
- 12 Valley View Cir
- 221 Miami Lakes Dr
- 5884 Stonebridge Cir
- 5880 Stonebridge Cir
- 250 Postoak Ln
- 1524 Summerview Ln
- 1514 Summerview Ln
- 5870 Parkview Ln
- 1548 Summerview Ln
- 1404 Madrid Ct
- 5821 Parkview Ln
- 772 Price Knoll Ln
- 5612 Flagstone Way
- 250 Logsby Place
- 710 Milford Hills Dr
- 718 Beechwood Ln
- 691 Signal Hill Dr
- 689 Signal Hill Dr
- 693 Signal Hill Dr
- 716 Beechwood Ln
- 709 Milford Hills Dr
- 714 Beechwood Ln
- 687 Signal Hill Dr
- 706 Milford Hills Dr
- 695 Signal Hill Dr
- 724 Milford Hills Dr
- 685 Signal Hill Dr
- 5761 Observation Ct
- 705 Milford Hills Dr
- 717 Ridgewood Ln
- 5757 Observation Ct
- 700 Signal Hill Dr
- 698 Signal Hill Dr
- 701 Milford Hills Dr