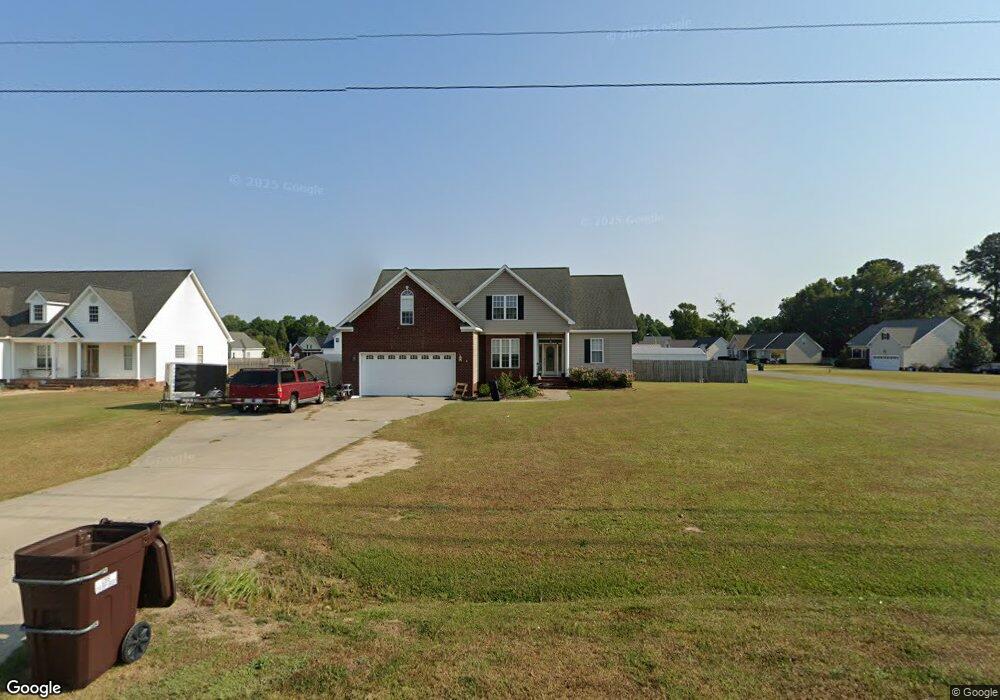
710 Buck Swamp Rd Goldsboro, NC 27530
Estimated Value: $340,533 - $366,000
4
Beds
3
Baths
2,415
Sq Ft
$145/Sq Ft
Est. Value
About This Home
This home is located at 710 Buck Swamp Rd, Goldsboro, NC 27530 and is currently estimated at $351,133, approximately $145 per square foot. 710 Buck Swamp Rd is a home located in Wayne County with nearby schools including Northwest Elementary School, Norwayne Middle School, and Charles B. Aycock High School.
Ownership History
Date
Name
Owned For
Owner Type
Purchase Details
Closed on
Aug 15, 2019
Sold by
Griffin James P and Griffin James Patric
Bought by
Griffin James P
Current Estimated Value
Home Financials for this Owner
Home Financials are based on the most recent Mortgage that was taken out on this home.
Original Mortgage
$200,000
Outstanding Balance
$175,163
Interest Rate
3.7%
Mortgage Type
VA
Estimated Equity
$175,970
Purchase Details
Closed on
Feb 20, 2015
Sold by
U S Bank Na
Bought by
Griffin James Patric
Home Financials for this Owner
Home Financials are based on the most recent Mortgage that was taken out on this home.
Original Mortgage
$183,000
Interest Rate
3.75%
Mortgage Type
VA
Purchase Details
Closed on
Sep 25, 2014
Sold by
Yelverton Robert F and Yelverton Wende N
Bought by
U S Bank Na
Purchase Details
Closed on
Sep 1, 2004
Purchase Details
Closed on
May 1, 2004
Create a Home Valuation Report for This Property
The Home Valuation Report is an in-depth analysis detailing your home's value as well as a comparison with similar homes in the area
Home Values in the Area
Average Home Value in this Area
Purchase History
| Date | Buyer | Sale Price | Title Company |
|---|---|---|---|
| Griffin James P | -- | None Available | |
| Griffin James Patric | $183,000 | None Available | |
| U S Bank Na | $197,008 | None Available | |
| -- | $198,500 | -- | |
| -- | $45,000 | -- |
Source: Public Records
Mortgage History
| Date | Status | Borrower | Loan Amount |
|---|---|---|---|
| Open | Griffin James P | $200,000 | |
| Closed | Griffin James Patric | $183,000 |
Source: Public Records
Tax History Compared to Growth
Tax History
| Year | Tax Paid | Tax Assessment Tax Assessment Total Assessment is a certain percentage of the fair market value that is determined by local assessors to be the total taxable value of land and additions on the property. | Land | Improvement |
|---|---|---|---|---|
| 2025 | $2,541 | $357,930 | $33,250 | $324,680 |
| 2024 | $2,079 | $246,610 | $21,380 | $225,230 |
| 2023 | $2,018 | $246,610 | $21,380 | $225,230 |
| 2022 | $2,018 | $246,610 | $21,380 | $225,230 |
| 2021 | $1,931 | $246,610 | $21,380 | $225,230 |
| 2020 | $1,823 | $246,610 | $21,380 | $225,230 |
| 2018 | $1,687 | $227,750 | $21,380 | $206,370 |
| 2017 | $1,687 | $227,750 | $21,380 | $206,370 |
| 2016 | $1,687 | $223,140 | $21,380 | $201,760 |
| 2015 | $1,657 | $223,140 | $21,380 | $201,760 |
| 2014 | $1,660 | $223,140 | $21,380 | $201,760 |
Source: Public Records
Map
Nearby Homes
- 205 Carlyle Cir
- 302 Morgan Trace Ln
- 600 Morgan Trace Ln
- 104 Angel Place
- 216 Koufax Dr
- 206 Koufax Dr
- 0 Buck Swamp Unit 100521598
- 408 Perkins Rd
- 461 Perkins
- 176 Perkins Rd
- 455 Perkins Rd
- 479 Perkins Rd
- 139 Livingston Dr
- 203 Lane Tree Dr
- 106 Yelverton Place
- 220 Creek Ridge Dr
- 101 Mcwood Place
- 276 Buck Swamp Rd
- 106 Pony Cir NW
- Lot 14 Pony Dr
- 718 Buck Swamp Rd
- 694 Buck Swamp Rd
- 103 Weatherby Dr
- 102 Mossburg Dr
- 728 Buck Swamp Rd
- 102 Weatherby Dr
- 686 Buck Swamp Rd
- 104 Mossburg Dr
- 104 Weatherby Dr
- 736 Buck Swamp Rd
- 106 Mossburg Dr
- 101 Morgan Trace Ln
- 200 Weatherby Dr
- 746 Buck Swamp Rd
- 201 Weatherby Dr
- 103 Morgan Trace Ln
- 731 Buck Swamp Rd
- 103 Mossburg Dr
- 108 Mossburg Dr
- 202 Weatherby Dr