710 Cemetery Rd Freeburg, IL 62243
Estimated Value: $188,000 - $292,000
2
Beds
2
Baths
992
Sq Ft
$247/Sq Ft
Est. Value
About This Home
This home is located at 710 Cemetery Rd, Freeburg, IL 62243 and is currently estimated at $244,819, approximately $246 per square foot. 710 Cemetery Rd is a home located in St. Clair County with nearby schools including Freeburg Elementary School, Freeburg Community High School, and St. Joseph Catholic School.
Ownership History
Date
Name
Owned For
Owner Type
Purchase Details
Closed on
Aug 14, 2012
Sold by
Downen Dirk and Downen Angela
Bought by
Downen Jerry
Current Estimated Value
Home Financials for this Owner
Home Financials are based on the most recent Mortgage that was taken out on this home.
Original Mortgage
$168,367
Outstanding Balance
$115,700
Interest Rate
3.5%
Mortgage Type
New Conventional
Estimated Equity
$129,119
Purchase Details
Closed on
Mar 21, 2008
Sold by
Forgy Glendal R
Bought by
Downen Dirk and Downen Angela
Home Financials for this Owner
Home Financials are based on the most recent Mortgage that was taken out on this home.
Original Mortgage
$140,250
Interest Rate
6.1%
Mortgage Type
Purchase Money Mortgage
Purchase Details
Closed on
Jun 30, 2006
Sold by
Forgy Glendal R and Forgy Mary L
Bought by
Forgy Mary L and Mary L Forgy Declaration Of Trust
Create a Home Valuation Report for This Property
The Home Valuation Report is an in-depth analysis detailing your home's value as well as a comparison with similar homes in the area
Home Values in the Area
Average Home Value in this Area
Purchase History
| Date | Buyer | Sale Price | Title Company |
|---|---|---|---|
| Downen Jerry | $165,000 | Nations Title Agency Mo Inc | |
| Downen Dirk | $165,000 | Benchmark Title Company | |
| Forgy Mary L | -- | None Available | |
| Forgy Glendal R | -- | None Available |
Source: Public Records
Mortgage History
| Date | Status | Borrower | Loan Amount |
|---|---|---|---|
| Open | Downen Jerry | $168,367 | |
| Previous Owner | Downen Dirk | $140,250 |
Source: Public Records
Tax History Compared to Growth
Tax History
| Year | Tax Paid | Tax Assessment Tax Assessment Total Assessment is a certain percentage of the fair market value that is determined by local assessors to be the total taxable value of land and additions on the property. | Land | Improvement |
|---|---|---|---|---|
| 2024 | $5,528 | $70,072 | $21,761 | $48,311 |
| 2023 | $4,538 | $56,802 | $10,948 | $45,854 |
| 2022 | $4,343 | $53,226 | $10,259 | $42,967 |
| 2021 | $4,199 | $50,109 | $9,658 | $40,451 |
| 2020 | $4,002 | $45,586 | $8,786 | $36,800 |
| 2019 | $3,951 | $46,885 | $9,080 | $37,805 |
| 2018 | $3,879 | $46,265 | $8,960 | $37,305 |
| 2017 | $3,712 | $44,235 | $8,567 | $35,668 |
| 2016 | $3,670 | $42,395 | $8,211 | $34,184 |
| 2014 | $3,225 | $42,017 | $8,426 | $33,591 |
| 2013 | $2,668 | $41,642 | $8,351 | $33,291 |
Source: Public Records
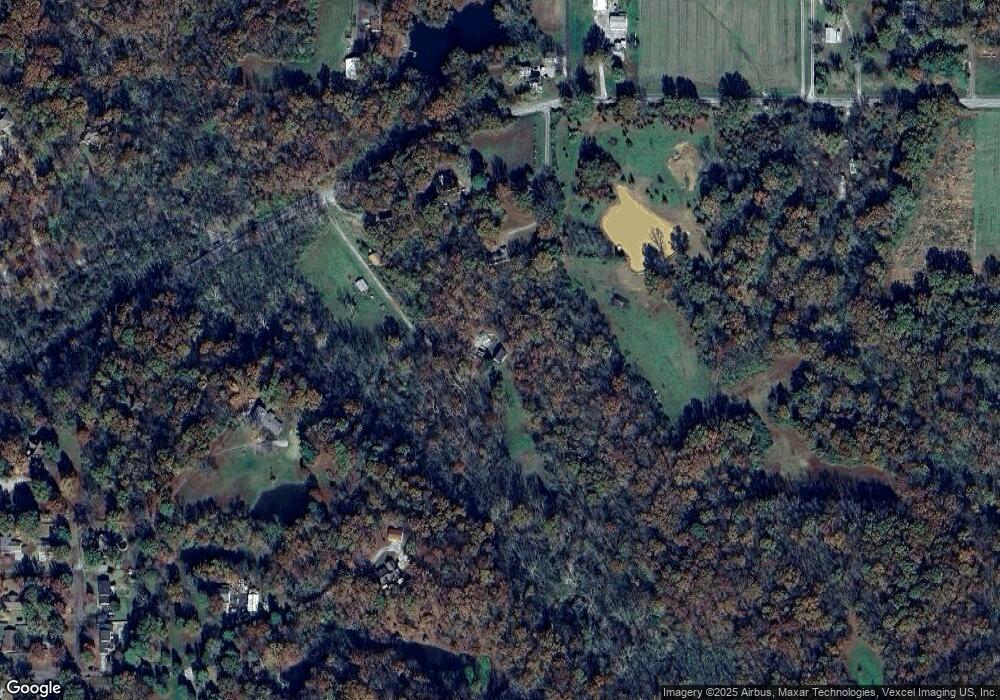
Map
Nearby Homes
- 3 Park St
- 0 Hickory Dr
- 109 Willow Dr
- 111 Willow Dr
- 103 Draco Dr
- 106 S Vine St
- 207 N Edison St
- 401 N Edison St
- tbb Illinois 15
- 520 N Edison St
- 312 W Phillips St
- 206 N Main St
- 302 N Railroad St
- 420 Foxtail Dr
- 440 Foxtail Dr
- 433 Foxtail Dr
- 304 Torrington Ln
- 359 Sleeping Indian Dr
- 363 Sleeping Indian Dr
- 222 Alamosa Dr
- 750 Cemetery Rd
- 113 Sunrise Dr
- 716 Cemetery Rd
- 150 Wild Cherry Ln
- 150 Wild Cherry Ln
- 740 Cemetery Rd
- 100 Sunrise Dr
- 619 Henderson Pointe Trail
- 755 Cemetery Rd
- 125 Sunrise Dr
- 170 Sunrise Dr
- 615 Henderson Pointe Trail
- 771 Cemetery Rd
- 767 Cemetery Rd
- 35 Lakeview Dr
- 37 Lakeview Dr
- 820 Cemetery Rd
- 32 Lakeview Dr
- 110 Wild Cherry Ln
- 110 Wild Cherry Ln