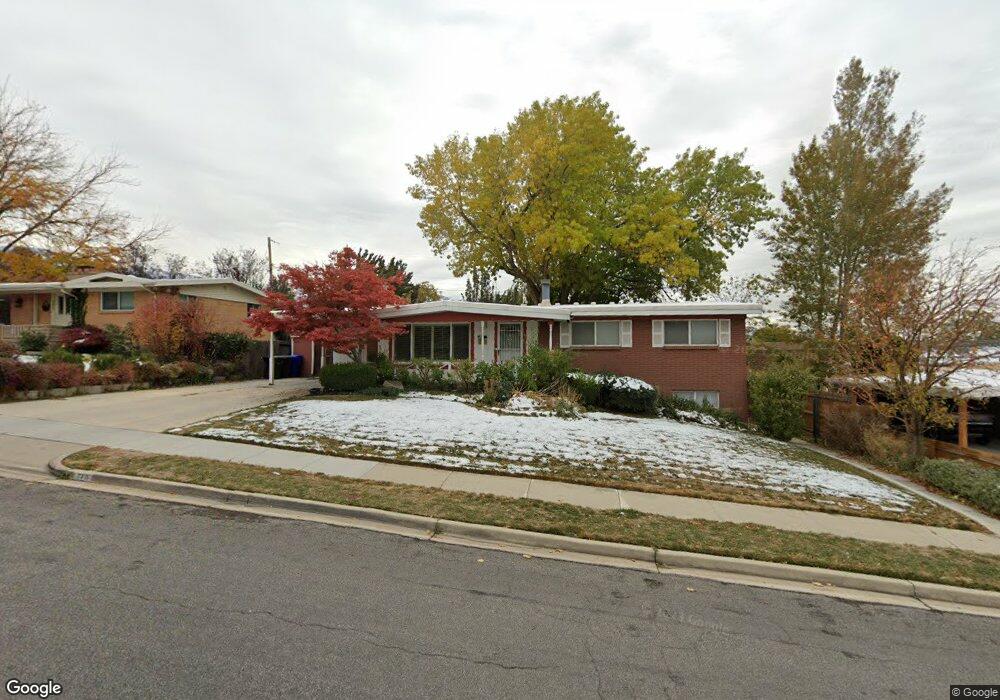
710 E 200 N Bountiful, UT 84010
Estimated Value: $538,000 - $606,000
4
Beds
3
Baths
1,787
Sq Ft
$325/Sq Ft
Est. Value
About This Home
This home is located at 710 E 200 N, Bountiful, UT 84010 and is currently estimated at $581,401, approximately $325 per square foot. 710 E 200 N is a home located in Davis County with nearby schools including Holbrook Elementary School, Bountiful Junior High School, and Bountiful High School.
Ownership History
Date
Name
Owned For
Owner Type
Purchase Details
Closed on
Mar 22, 2021
Sold by
Brown Carole L and Estate Of Carole Lee Abercromb
Bought by
Abercromble John Charles
Current Estimated Value
Home Financials for this Owner
Home Financials are based on the most recent Mortgage that was taken out on this home.
Original Mortgage
$325,000
Outstanding Balance
$291,339
Interest Rate
2.7%
Mortgage Type
New Conventional
Estimated Equity
$290,062
Purchase Details
Closed on
Mar 20, 2021
Sold by
Abercronible David E and Estate Of Carole Lee Abercombl
Bought by
Abercrombie John Charles
Home Financials for this Owner
Home Financials are based on the most recent Mortgage that was taken out on this home.
Original Mortgage
$325,000
Outstanding Balance
$291,339
Interest Rate
2.7%
Mortgage Type
New Conventional
Estimated Equity
$290,062
Purchase Details
Closed on
Jul 22, 1998
Sold by
Abercrombie Carole L
Bought by
Abercrombie Carole L
Home Financials for this Owner
Home Financials are based on the most recent Mortgage that was taken out on this home.
Original Mortgage
$80,100
Interest Rate
6.58%
Create a Home Valuation Report for This Property
The Home Valuation Report is an in-depth analysis detailing your home's value as well as a comparison with similar homes in the area
Purchase History
| Date | Buyer | Sale Price | Title Company |
|---|---|---|---|
| Abercromble John Charles | -- | First American Title | |
| Abercrombie John Charles | -- | First American Title | |
| Abercrombie Carole L | -- | -- |
Source: Public Records
Mortgage History
| Date | Status | Borrower | Loan Amount |
|---|---|---|---|
| Open | Abercrombie John Charles | $325,000 | |
| Previous Owner | Abercrombie Carole L | $80,100 |
Source: Public Records
Tax History
| Year | Tax Paid | Tax Assessment Tax Assessment Total Assessment is a certain percentage of the fair market value that is determined by local assessors to be the total taxable value of land and additions on the property. | Land | Improvement |
|---|---|---|---|---|
| 2025 | $3,395 | $312,400 | $123,593 | $188,807 |
| 2024 | $3,194 | $304,150 | $114,105 | $190,045 |
| 2023 | $3,053 | $527,000 | $204,904 | $322,096 |
| 2022 | $3,240 | $307,450 | $108,834 | $198,616 |
| 2021 | $2,785 | $403,000 | $161,590 | $241,410 |
| 2020 | $2,459 | $357,000 | $147,181 | $209,819 |
| 2019 | $2,508 | $356,000 | $149,440 | $206,560 |
| 2018 | $2,334 | $326,000 | $138,208 | $187,792 |
| 2016 | $1,873 | $140,910 | $42,349 | $98,561 |
| 2015 | $1,819 | $129,140 | $42,349 | $86,791 |
| 2014 | $1,757 | $128,105 | $42,349 | $85,756 |
| 2013 | -- | $117,366 | $51,700 | $65,666 |
Source: Public Records
Map
Nearby Homes
- 683 E 100 N
- 129 N 800 E
- 6 N 800 E
- 513 N 400 E Unit 14B
- 453 N 400 E Unit 7-D
- 1138 Briggs Dr
- 456 E 500 S
- 520 S Orchard Dr Unit 17
- 255 E 400 S
- 275 E Peach Ln S
- 323 Peach Ln
- 908 Northern Hills Dr Unit 3
- 49 E 200 N Unit 4
- 41 E 200 N Unit 6
- 55 E 200 N Unit 2
- 51 E 200 N Unit 3
- 357 S 100 E
- 254 N Main St
- 256 N Main St
- 252 N Main St
Your Personal Tour Guide
Ask me questions while you tour the home.