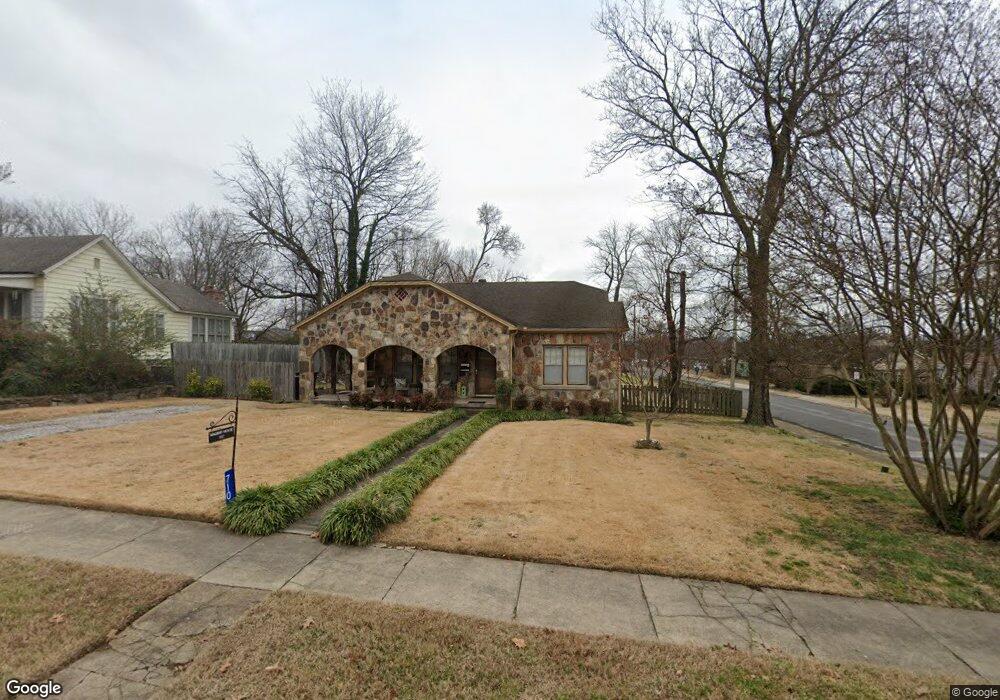
710 E Boswell St Batesville, AR 72501
Estimated Value: $141,000 - $228,000
Studio
1
Bath
1,548
Sq Ft
$124/Sq Ft
Est. Value
About This Home
This home is located at 710 E Boswell St, Batesville, AR 72501 and is currently estimated at $191,251, approximately $123 per square foot. 710 E Boswell St is a home located in Independence County with nearby schools including Batesville Junior High School, Batesville High School, and Hope Lutheran School.
Ownership History
Date
Name
Owned For
Owner Type
Purchase Details
Closed on
Dec 4, 2025
Sold by
Swaim Benjamin
Bought by
Swanson Brent
Current Estimated Value
Purchase Details
Closed on
Mar 4, 2019
Sold by
Rutledge Louise
Bought by
Swaim Lewis and Swaim Judy
Home Financials for this Owner
Home Financials are based on the most recent Mortgage that was taken out on this home.
Original Mortgage
$103,500
Interest Rate
4.4%
Mortgage Type
Future Advance Clause Open End Mortgage
Purchase Details
Closed on
Aug 19, 2004
Sold by
Not Provided
Bought by
Rutledge Louise
Purchase Details
Closed on
Apr 30, 1999
Bought by
Holmes Kaven and Barbara Larkins
Purchase Details
Closed on
Sep 21, 1993
Bought by
Gooch Michael L
Purchase Details
Closed on
Jun 18, 1990
Bought by
Hensley Joyce
Purchase Details
Closed on
Oct 26, 1977
Bought by
Alley David
Create a Home Valuation Report for This Property
The Home Valuation Report is an in-depth analysis detailing your home's value as well as a comparison with similar homes in the area
Purchase History
| Date | Buyer | Sale Price | Title Company |
|---|---|---|---|
| Swanson Brent | $230,000 | None Listed On Document | |
| Swaim Lewis | $103,500 | None Available | |
| Rutledge Louise | $90,000 | -- | |
| Rutledge Louise | $90,000 | -- | |
| Holmes Kaven | $71,000 | -- | |
| Gooch Michael L | $67,000 | -- | |
| Hensley Joyce | $60,000 | -- | |
| Alley David | -- | -- |
Source: Public Records
Mortgage History
| Date | Status | Borrower | Loan Amount |
|---|---|---|---|
| Previous Owner | Swaim Lewis | $103,500 |
Source: Public Records
Tax History
| Year | Tax Paid | Tax Assessment Tax Assessment Total Assessment is a certain percentage of the fair market value that is determined by local assessors to be the total taxable value of land and additions on the property. | Land | Improvement |
|---|---|---|---|---|
| 2025 | $998 | $28,080 | $3,870 | $24,210 |
| 2024 | $998 | $28,080 | $3,870 | $24,210 |
| 2023 | $755 | $22,120 | $3,870 | $18,250 |
| 2022 | $805 | $22,120 | $3,870 | $18,250 |
| 2021 | $1,180 | $22,120 | $3,870 | $18,250 |
| 2020 | $1,180 | $22,120 | $3,870 | $18,250 |
| 2019 | $1,080 | $20,240 | $3,420 | $16,820 |
| 2018 | $1,080 | $20,240 | $3,420 | $16,820 |
| 2017 | $305 | $20,240 | $3,420 | $16,820 |
| 2016 | $305 | $20,240 | $3,420 | $16,820 |
| 2015 | $300 | $20,240 | $3,420 | $16,820 |
| 2014 | $305 | $12,414 | $2,068 | $10,346 |
Source: Public Records
Map
Nearby Homes
Your Personal Tour Guide
Ask me questions while you tour the home.