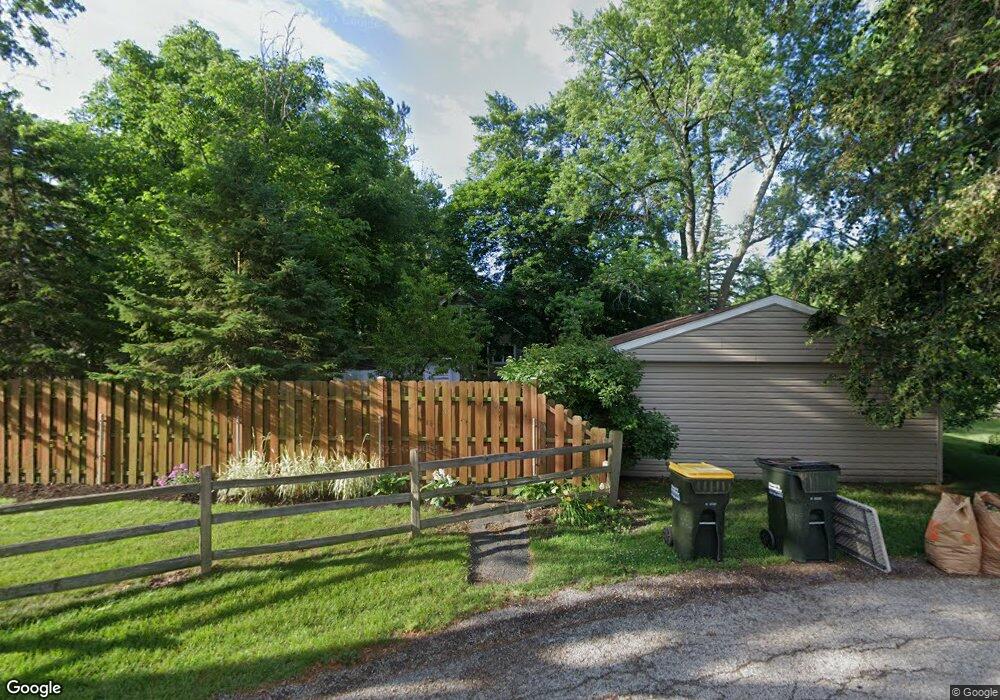
710 E Camp Mcdonald Rd Prospect Heights, IL 60070
Estimated Value: $359,000 - $438,374
3
Beds
2
Baths
1,148
Sq Ft
$343/Sq Ft
Est. Value
About This Home
This home is located at 710 E Camp Mcdonald Rd, Prospect Heights, IL 60070 and is currently estimated at $393,844, approximately $343 per square foot. 710 E Camp Mcdonald Rd is a home located in Cook County with nearby schools including Frost Elementary School, Oliver W Holmes Middle School, and Wheeling High School.
Ownership History
Date
Name
Owned For
Owner Type
Purchase Details
Closed on
May 10, 2021
Sold by
Nowak Anthony and Nowak Lillian
Bought by
Nowak Anthony and Nowak Lillian
Current Estimated Value
Purchase Details
Closed on
Aug 15, 2019
Sold by
Pinas Jesse
Bought by
Nowak Anthony and Nowak Lillian
Purchase Details
Closed on
Jan 31, 2008
Sold by
Nowak Anthony and Nowak Lillian
Bought by
Pinas Jesse
Purchase Details
Closed on
Jul 13, 2007
Sold by
Nowak Anthony
Bought by
Nowak Anthony and Nowak Lillian
Purchase Details
Closed on
Feb 14, 1996
Sold by
Petersen Paul William and Petersen Patricia Joy
Bought by
Nowak Anthony
Home Financials for this Owner
Home Financials are based on the most recent Mortgage that was taken out on this home.
Original Mortgage
$85,000
Interest Rate
7.16%
Create a Home Valuation Report for This Property
The Home Valuation Report is an in-depth analysis detailing your home's value as well as a comparison with similar homes in the area
Home Values in the Area
Average Home Value in this Area
Purchase History
| Date | Buyer | Sale Price | Title Company |
|---|---|---|---|
| Nowak Anthony | -- | Attorney | |
| Nowak Anthony | -- | Attorney | |
| Pinas Jesse | -- | None Available | |
| Nowak Anthony | -- | None Available | |
| Nowak Anthony | $170,000 | -- |
Source: Public Records
Mortgage History
| Date | Status | Borrower | Loan Amount |
|---|---|---|---|
| Previous Owner | Nowak Anthony | $85,000 |
Source: Public Records
Tax History
| Year | Tax Paid | Tax Assessment Tax Assessment Total Assessment is a certain percentage of the fair market value that is determined by local assessors to be the total taxable value of land and additions on the property. | Land | Improvement |
|---|---|---|---|---|
| 2025 | $8,866 | $33,000 | $17,488 | $15,512 |
| 2024 | $8,866 | $32,000 | $14,726 | $17,274 |
| 2023 | $8,256 | $32,000 | $14,726 | $17,274 |
| 2022 | $8,256 | $32,000 | $14,726 | $17,274 |
| 2021 | $6,337 | $23,127 | $8,283 | $14,844 |
| 2020 | $6,287 | $23,127 | $8,283 | $14,844 |
| 2019 | $7,272 | $25,899 | $8,283 | $17,616 |
| 2018 | $6,490 | $21,559 | $7,363 | $14,196 |
| 2017 | $6,389 | $21,559 | $7,363 | $14,196 |
| 2016 | $6,258 | $21,559 | $7,363 | $14,196 |
| 2015 | $5,943 | $19,300 | $6,442 | $12,858 |
| 2014 | $5,889 | $19,300 | $6,442 | $12,858 |
| 2013 | $5,459 | $19,300 | $6,442 | $12,858 |
Source: Public Records
Map
Nearby Homes
- 103 Coldren Dr
- 7 Alton Rd
- 584 Edinburgh Ln Unit A
- 109 Rob Roy Ln Unit C
- 509 Aberdeen Ln Unit C
- 501 Aberdeen Ln Unit C
- 1975 Merlot Ct
- 15 E Willow Rd
- 55 Willow Rd
- 304 E Camp Mcdonald Rd
- 513 Green Bridge Ln Unit B
- 1414 N Indigo Dr
- 206 E Camp Mcdonald Rd
- 1107 N Greenfield Ln
- 42 Cherbourg Ct Unit 492714
- 1176 N Boxwood Dr Unit A
- 100 Hawthorne Place
- 16 E Old Willow Rd Unit 214S
- 16 E Old Willow Rd Unit 223S
- 16 E Old Willow Rd Unit 435S
- 706 Rose Ave
- 6 Coldren Dr
- 708 Rose Ave
- 7 E Elaine Cir
- 9 E Elaine Cir
- 708 E Camp Mcdonald Rd
- 2 Coldren Dr
- 5 E Elaine Cir
- 710 Rose Ave
- 102 Coldren Dr
- 5 Coldren Dr
- 706 E Camp Mcdonald Rd
- 11 E Elaine Cir
- 704 E Camp Mcdonald Rd
- 802 Rose Ave
- 1 Coldren Dr
- 803 Rose Ave
- 101 E Elaine Cir
- 104 Coldren Dr
- 702 E Elaine Cir
Your Personal Tour Guide
Ask me questions while you tour the home.