Estimated Value: $450,000 - $552,000
5
Beds
4
Baths
3,891
Sq Ft
$129/Sq Ft
Est. Value
About This Home
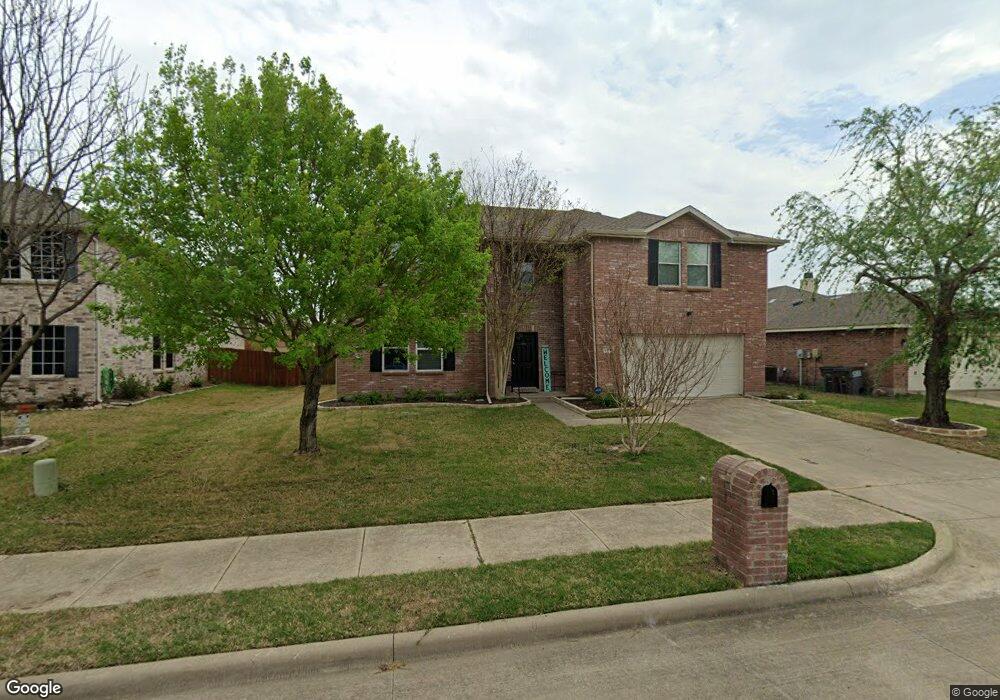
This home is located at 710 Hanceville Way, Wylie, TX 75098 and is currently estimated at $502,157, approximately $129 per square foot. 710 Hanceville Way is a home located in Collin County with nearby schools including Dodd Elementary School, Frank Mcmillan Junior High School, and Davis Intermediate School.
Ownership History
Date
Name
Owned For
Owner Type
Purchase Details
Closed on
Mar 8, 2019
Sold by
Regan Properties Llc
Bought by
Ivener Jacob M and Ivener Monica A
Current Estimated Value
Home Financials for this Owner
Home Financials are based on the most recent Mortgage that was taken out on this home.
Original Mortgage
$276,450
Outstanding Balance
$243,047
Interest Rate
4.4%
Mortgage Type
Purchase Money Mortgage
Estimated Equity
$259,110
Purchase Details
Closed on
Mar 12, 2018
Sold by
Beatty Darren
Bought by
Regan Properties Llc and Xqc Property Llc
Purchase Details
Closed on
Jun 2, 2005
Sold by
Centex Homes
Bought by
Beatty Darren
Home Financials for this Owner
Home Financials are based on the most recent Mortgage that was taken out on this home.
Original Mortgage
$148,600
Interest Rate
6.95%
Mortgage Type
Fannie Mae Freddie Mac
Create a Home Valuation Report for This Property
The Home Valuation Report is an in-depth analysis detailing your home's value as well as a comparison with similar homes in the area
Home Values in the Area
Average Home Value in this Area
Purchase History
| Date | Buyer | Sale Price | Title Company |
|---|---|---|---|
| Ivener Jacob M | -- | None Available | |
| Regan Properties Llc | -- | None Available | |
| Beatty Darren | -- | -- |
Source: Public Records
Mortgage History
| Date | Status | Borrower | Loan Amount |
|---|---|---|---|
| Open | Ivener Jacob M | $276,450 | |
| Previous Owner | Beatty Darren | $148,600 | |
| Closed | Beatty Darren | $37,100 |
Source: Public Records
Tax History Compared to Growth
Tax History
| Year | Tax Paid | Tax Assessment Tax Assessment Total Assessment is a certain percentage of the fair market value that is determined by local assessors to be the total taxable value of land and additions on the property. | Land | Improvement |
|---|---|---|---|---|
| 2025 | $7,768 | $506,860 | $95,000 | $442,932 |
| 2024 | $7,768 | $460,782 | $95,000 | $421,977 |
| 2023 | $7,768 | $418,893 | $80,000 | $400,691 |
| 2022 | $8,355 | $380,812 | $80,000 | $350,328 |
| 2021 | $8,145 | $346,193 | $65,000 | $281,193 |
| 2020 | $7,913 | $318,672 | $55,000 | $263,672 |
| 2019 | $8,553 | $325,490 | $55,000 | $270,490 |
| 2018 | $8,468 | $314,427 | $55,000 | $259,427 |
| 2017 | $8,828 | $327,809 | $50,000 | $277,809 |
| 2016 | $7,905 | $284,512 | $40,000 | $244,512 |
| 2015 | $6,294 | $229,467 | $35,000 | $194,467 |
Source: Public Records
Map
Nearby Homes
- 626 Gunters Mountain Ln
- 713 Kinston Ct
- 705 Baldwin Rd
- 902 Greene Way
- 908 Greene Way
- 1305 Mobile Ln
- 1003 Ann Dr
- 2049 Quail Run Rd
- 907 Carlton Rd
- 1312 Meziere Sky Dr
- 913 Chickesaw Ln
- 1306 Ardmore Way
- 605 Graham Ct
- 410 Oxford Dr
- 1428 Mars Lander Ln
- 1426 Mars Lander Ln
- 1430 Mars Lander Ln
- 1432 Mars Lander Ln
- 1422 Mars Lander Ln
- Crest Plan at The Apollo
- 708 Hanceville Way
- 712 Hanceville Way
- 713 Gunters Mountain Ln
- 714 Hanceville Way
- 706 Hanceville Way
- 711 Gunters Mountain Ln
- 715 Gunters Mountain Ln
- 709 Gunters Mountain Ln
- 711 Hanceville Way
- 717 Gunters Mountain Ln
- 709 Hanceville Way
- 716 Hanceville Way
- 704 Hanceville Way
- 713 Hanceville Way
- 707 Gunters Mountain Ln
- 707 Hanceville Way
- 719 Gunters Mountain Ln
- 715 Hanceville Way
- 705 Hanceville Way
- 702 Hanceville Way