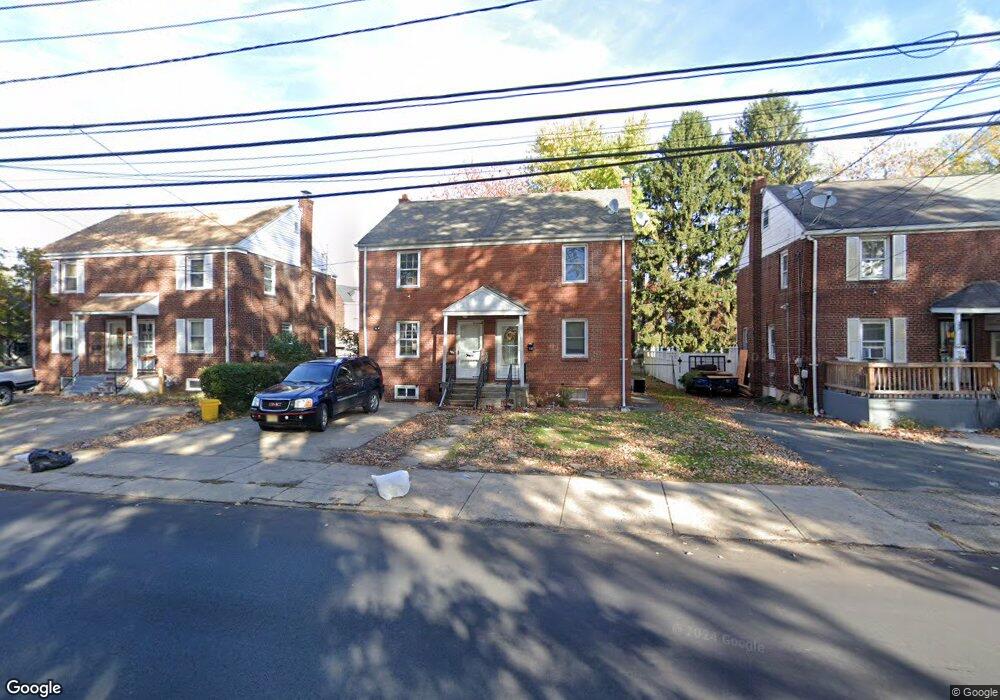
710 Lalor St Trenton, NJ 08610
Franklin Park NeighborhoodEstimated Value: $145,000 - $194,000
2
Beds
1
Bath
832
Sq Ft
$196/Sq Ft
Est. Value
About This Home
This home is located at 710 Lalor St, Trenton, NJ 08610 and is currently estimated at $163,468, approximately $196 per square foot. 710 Lalor St is a home located in Mercer County with nearby schools including Franklin Elementary School, Dr. Crosby Copeland Elementary School, and Grace A Dunn Middle School.
Ownership History
Date
Name
Owned For
Owner Type
Purchase Details
Closed on
Jun 17, 2016
Sold by
Choresh Idan
Bought by
Graf Gal
Current Estimated Value
Purchase Details
Closed on
Nov 23, 2015
Sold by
Sepulveda Carlos M and Torres Monserath M
Bought by
Choresh Idan
Purchase Details
Closed on
Feb 17, 2009
Sold by
Wierzbicki Thomas W
Bought by
Sepulveda Carlos M and Torres Monserath M
Home Financials for this Owner
Home Financials are based on the most recent Mortgage that was taken out on this home.
Original Mortgage
$68,633
Interest Rate
5.14%
Mortgage Type
FHA
Create a Home Valuation Report for This Property
The Home Valuation Report is an in-depth analysis detailing your home's value as well as a comparison with similar homes in the area
Home Values in the Area
Average Home Value in this Area
Purchase History
| Date | Buyer | Sale Price | Title Company |
|---|---|---|---|
| Graf Gal | $60,000 | None Available | |
| Choresh Idan | $30,000 | Attorney | |
| Sepulveda Carlos M | $69,900 | Old Republic National Title |
Source: Public Records
Mortgage History
| Date | Status | Borrower | Loan Amount |
|---|---|---|---|
| Previous Owner | Sepulveda Carlos M | $68,633 |
Source: Public Records
Tax History Compared to Growth
Tax History
| Year | Tax Paid | Tax Assessment Tax Assessment Total Assessment is a certain percentage of the fair market value that is determined by local assessors to be the total taxable value of land and additions on the property. | Land | Improvement |
|---|---|---|---|---|
| 2025 | $2,407 | $41,500 | $7,600 | $33,900 |
| 2024 | $2,310 | $41,500 | $7,600 | $33,900 |
| 2023 | $2,310 | $41,500 | $7,600 | $33,900 |
| 2022 | $2,265 | $41,500 | $7,600 | $33,900 |
| 2021 | $2,305 | $41,500 | $7,600 | $33,900 |
| 2020 | $2,297 | $41,500 | $7,600 | $33,900 |
| 2019 | $2,260 | $41,500 | $7,600 | $33,900 |
| 2018 | $2,163 | $41,500 | $7,600 | $33,900 |
| 2017 | $2,056 | $41,500 | $7,600 | $33,900 |
| 2016 | $4,470 | $77,700 | $16,000 | $61,700 |
| 2015 | $4,455 | $77,700 | $16,000 | $61,700 |
| 2014 | $4,434 | $77,700 | $16,000 | $61,700 |
Source: Public Records
Map
Nearby Homes