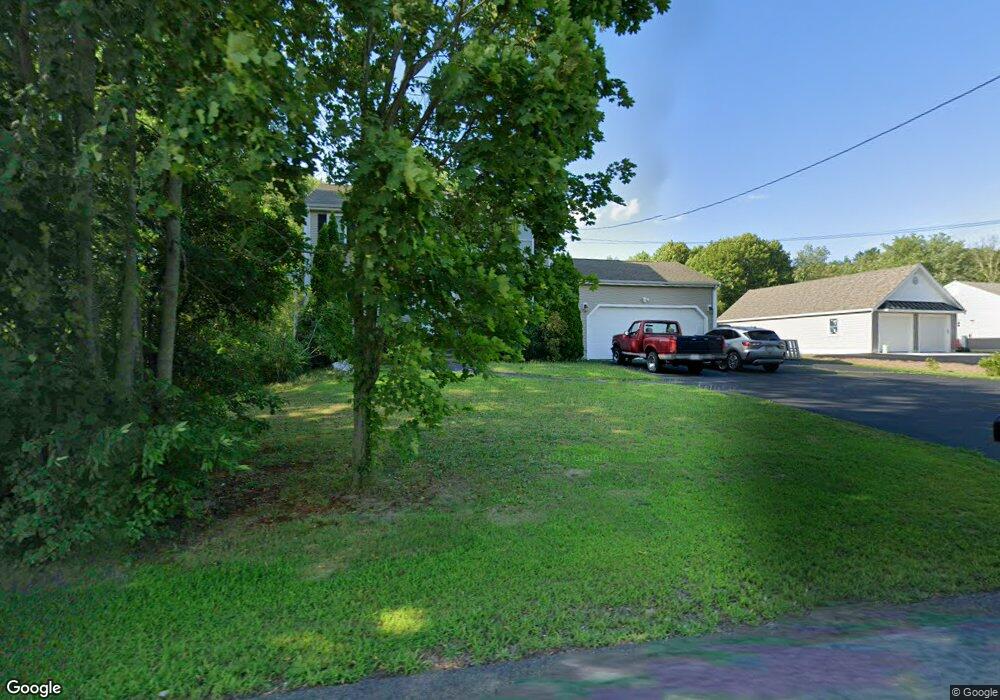
710 Main St Hanson, MA 02341
Estimated Value: $635,131 - $780,000
3
Beds
3
Baths
1,794
Sq Ft
$387/Sq Ft
Est. Value
About This Home
This home is located at 710 Main St, Hanson, MA 02341 and is currently estimated at $693,783, approximately $386 per square foot. 710 Main St is a home located in Plymouth County.
Ownership History
Date
Name
Owned For
Owner Type
Purchase Details
Closed on
Jun 14, 2002
Sold by
Mitchell Brian J
Bought by
Firth Joy E and Firth James E
Current Estimated Value
Purchase Details
Closed on
Jan 18, 2001
Sold by
Hanson Medical Bldg
Bought by
Mitchell Brian J
Home Financials for this Owner
Home Financials are based on the most recent Mortgage that was taken out on this home.
Original Mortgage
$187,500
Interest Rate
7.52%
Mortgage Type
Purchase Money Mortgage
Create a Home Valuation Report for This Property
The Home Valuation Report is an in-depth analysis detailing your home's value as well as a comparison with similar homes in the area
Home Values in the Area
Average Home Value in this Area
Purchase History
| Date | Buyer | Sale Price | Title Company |
|---|---|---|---|
| Firth Joy E | $339,900 | -- | |
| Mitchell Brian J | $75,000 | -- |
Source: Public Records
Mortgage History
| Date | Status | Borrower | Loan Amount |
|---|---|---|---|
| Open | Mitchell Brian J | $38,000 | |
| Closed | Mitchell Brian J | $33,000 | |
| Open | Mitchell Brian J | $70,000 | |
| Previous Owner | Mitchell Brian J | $187,500 |
Source: Public Records
Tax History
| Year | Tax Paid | Tax Assessment Tax Assessment Total Assessment is a certain percentage of the fair market value that is determined by local assessors to be the total taxable value of land and additions on the property. | Land | Improvement |
|---|---|---|---|---|
| 2025 | $7,221 | $539,700 | $163,700 | $376,000 |
| 2024 | $7,074 | $528,700 | $158,900 | $369,800 |
| 2023 | $6,879 | $485,100 | $158,900 | $326,200 |
| 2022 | $6,717 | $445,100 | $144,500 | $300,600 |
| 2021 | $12,939 | $395,900 | $138,900 | $257,000 |
| 2020 | $5,890 | $385,700 | $134,200 | $251,500 |
| 2019 | $11,960 | $363,400 | $131,600 | $231,800 |
| 2018 | $10,604 | $352,300 | $126,600 | $225,700 |
| 2017 | $5,404 | $338,200 | $120,500 | $217,700 |
| 2016 | $5,483 | $331,300 | $120,500 | $210,800 |
| 2015 | $5,185 | $325,700 | $120,500 | $205,200 |
Source: Public Records
Map
Nearby Homes
- 1054 Main St
- 72 Phillips St
- 318 South St
- 170 Elm St
- 143 Plymouth St
- Lot 6 Way
- Lot 2 Harvard Rd
- 361A County Rd
- 361 County Rd
- 102 Leon Ct
- 115 Waltham St
- 0 Union Park St
- 134 Crescent St
- 61 Sawmill Ln
- 61 Sawmill Ln Unit 61
- 161 Winter St Unit 11
- 6 Amanda's Way Unit 6
- 501 W Washington St
- 131 Elmer St
- 26 Franklin St
Your Personal Tour Guide
Ask me questions while you tour the home.