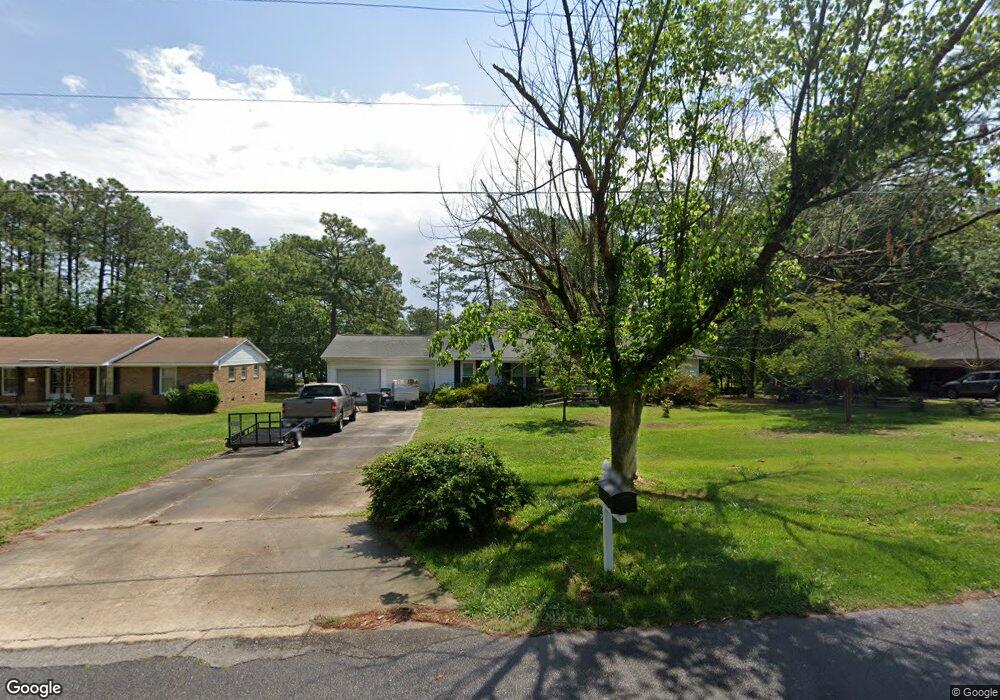
710 Mclean St Raeford, NC 28376
Estimated Value: $242,982 - $278,000
3
Beds
2
Baths
1,748
Sq Ft
$145/Sq Ft
Est. Value
About This Home
This home is located at 710 Mclean St, Raeford, NC 28376 and is currently estimated at $253,996, approximately $145 per square foot. 710 Mclean St is a home located in Hoke County with nearby schools including J.W. McLauchlin Elementary School, West Hoke Middle, and Hoke County High.
Ownership History
Date
Name
Owned For
Owner Type
Purchase Details
Closed on
Jul 19, 2018
Sold by
Tapp Nancy Sanks and The John L Sanks & Martha J Sa
Bought by
Tapp Nancy Sanks and Tapp Barry Wayne
Current Estimated Value
Purchase Details
Closed on
Jul 24, 2009
Sold by
Mulholland Roger L and Mulholland Clarissa T
Bought by
Sanks John L and Martha J Sanks Living Trust
Purchase Details
Closed on
Feb 15, 2006
Sold by
Cordick Stephanie Beaver and Estate Of Doris Barnes Beaver
Bought by
Mulholland Roger L and Mulholland Clarissa T
Home Financials for this Owner
Home Financials are based on the most recent Mortgage that was taken out on this home.
Original Mortgage
$137,344
Interest Rate
6.08%
Mortgage Type
FHA
Create a Home Valuation Report for This Property
The Home Valuation Report is an in-depth analysis detailing your home's value as well as a comparison with similar homes in the area
Home Values in the Area
Average Home Value in this Area
Purchase History
| Date | Buyer | Sale Price | Title Company |
|---|---|---|---|
| Tapp Nancy Sanks | -- | None Available | |
| Sanks John L | $150,000 | -- | |
| Mulholland Roger L | $141,000 | None Available |
Source: Public Records
Mortgage History
| Date | Status | Borrower | Loan Amount |
|---|---|---|---|
| Previous Owner | Mulholland Roger L | $137,344 |
Source: Public Records
Tax History Compared to Growth
Tax History
| Year | Tax Paid | Tax Assessment Tax Assessment Total Assessment is a certain percentage of the fair market value that is determined by local assessors to be the total taxable value of land and additions on the property. | Land | Improvement |
|---|---|---|---|---|
| 2025 | $1,154 | $158,120 | $33,520 | $124,600 |
| 2024 | $1,154 | $158,120 | $33,520 | $124,600 |
| 2023 | $1,154 | $158,120 | $33,520 | $124,600 |
| 2022 | $1,131 | $158,120 | $33,520 | $124,600 |
| 2021 | $1,163 | $158,290 | $26,460 | $131,830 |
| 2020 | $1,187 | $158,290 | $26,460 | $131,830 |
| 2019 | $1,187 | $158,290 | $26,460 | $131,830 |
| 2018 | $1,187 | $158,290 | $26,460 | $131,830 |
| 2017 | $1,187 | $158,290 | $26,460 | $131,830 |
| 2016 | -- | $158,290 | $26,460 | $131,830 |
| 2015 | -- | $158,290 | $26,460 | $131,830 |
| 2014 | $1,156 | $158,290 | $26,460 | $131,830 |
| 2013 | -- | $123,470 | $21,170 | $102,300 |
Source: Public Records
Map
Nearby Homes