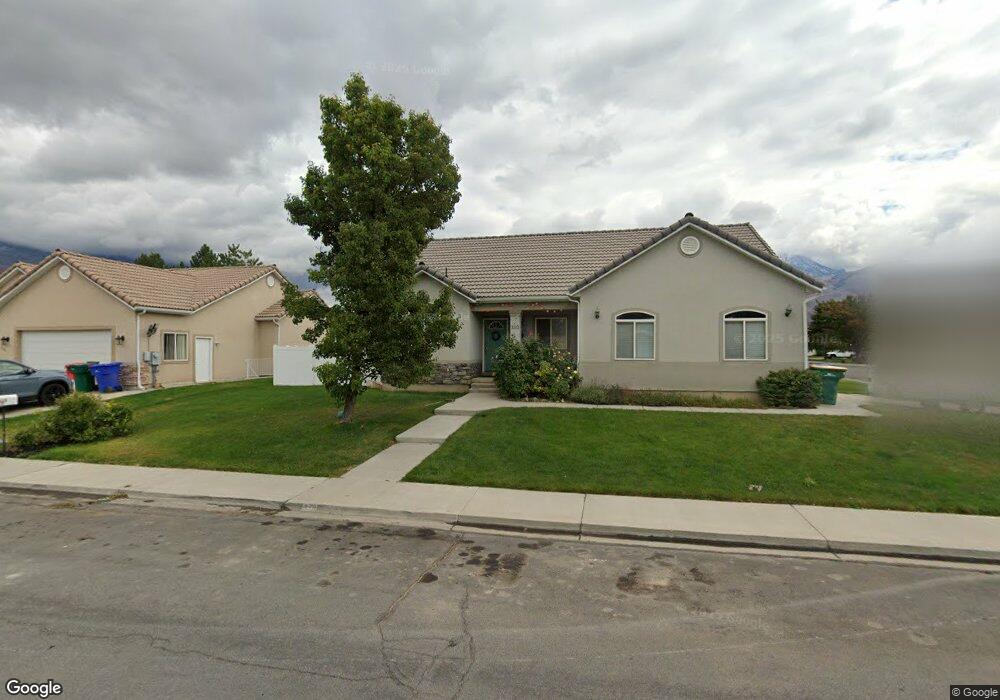
710 N 450 E Unit 5 Orem, UT 84097
Orchard South NeighborhoodEstimated Value: $529,000 - $1,495,000
3
Beds
3
Baths
1,389
Sq Ft
$622/Sq Ft
Est. Value
About This Home
This home is located at 710 N 450 E Unit 5, Orem, UT 84097 and is currently estimated at $864,208, approximately $622 per square foot. 710 N 450 E Unit 5 is a home located in Utah County with nearby schools including Cascade Elementary School, Canyon View Junior High School, and Orem High School.
Ownership History
Date
Name
Owned For
Owner Type
Purchase Details
Closed on
Jul 17, 2020
Sold by
Hebert Kendrick J and The Kendrick J Herbert Revocab
Bought by
Hebert Keith J and Hebert Darlene
Current Estimated Value
Home Financials for this Owner
Home Financials are based on the most recent Mortgage that was taken out on this home.
Original Mortgage
$262,975
Outstanding Balance
$233,189
Interest Rate
3.1%
Mortgage Type
New Conventional
Estimated Equity
$631,019
Purchase Details
Closed on
Sep 16, 2016
Sold by
Hebert Ken J
Bought by
Herbert Kendrick J
Purchase Details
Closed on
Oct 14, 1999
Sold by
G & J Construction Inc
Bought by
Stratford Park Lc
Purchase Details
Closed on
Sep 28, 1999
Sold by
Stratford Park Lc
Bought by
Hebert Ken J and Hebert Jeanette
Create a Home Valuation Report for This Property
The Home Valuation Report is an in-depth analysis detailing your home's value as well as a comparison with similar homes in the area
Home Values in the Area
Average Home Value in this Area
Purchase History
| Date | Buyer | Sale Price | Title Company |
|---|---|---|---|
| Hebert Keith J | -- | First Amer Orem Ctr Street | |
| Herbert Kendrick J | -- | Accommodation | |
| Stratford Park Lc | -- | Mountain West Title Co | |
| Hebert Ken J | -- | Mountain West Title Co |
Source: Public Records
Mortgage History
| Date | Status | Borrower | Loan Amount |
|---|---|---|---|
| Open | Hebert Keith J | $262,975 |
Source: Public Records
Tax History
| Year | Tax Paid | Tax Assessment Tax Assessment Total Assessment is a certain percentage of the fair market value that is determined by local assessors to be the total taxable value of land and additions on the property. | Land | Improvement |
|---|---|---|---|---|
| 2025 | $2,209 | $290,455 | -- | -- |
| 2024 | $2,209 | $270,160 | $0 | $0 |
| 2023 | $2,066 | $271,535 | $0 | $0 |
| 2022 | $2,214 | $281,930 | $0 | $0 |
| 2021 | $2,083 | $401,700 | $139,800 | $261,900 |
| 2020 | $1,945 | $368,600 | $111,800 | $256,800 |
| 2019 | $1,674 | $330,000 | $104,800 | $225,200 |
| 2018 | $1,682 | $316,700 | $101,300 | $215,400 |
| 2017 | $1,608 | $162,250 | $0 | $0 |
| 2016 | $1,644 | $152,955 | $0 | $0 |
| 2015 | $1,617 | $142,230 | $0 | $0 |
| 2014 | $1,538 | $134,695 | $0 | $0 |
Source: Public Records
Map
Nearby Homes
Your Personal Tour Guide
Ask me questions while you tour the home.