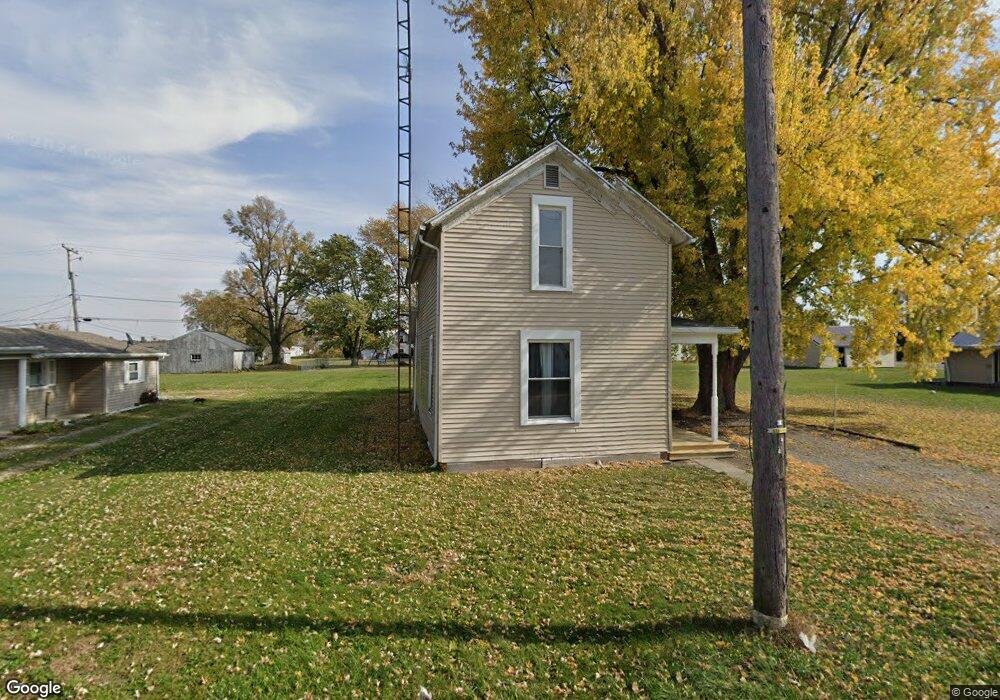
710 N Broadway St Spencerville, OH 45887
Estimated Value: $93,000 - $137,000
3
Beds
1
Bath
1,026
Sq Ft
$113/Sq Ft
Est. Value
About This Home
This home is located at 710 N Broadway St, Spencerville, OH 45887 and is currently estimated at $116,000, approximately $113 per square foot. 710 N Broadway St is a home located in Allen County with nearby schools including Spencerville Elementary School, Spencerville Middle School, and Spencerville High School.
Ownership History
Date
Name
Owned For
Owner Type
Purchase Details
Closed on
Sep 7, 2017
Sold by
Kidd Gregory C and Kidd Dionne R
Bought by
H I Properties Llc and H I Properties
Current Estimated Value
Home Financials for this Owner
Home Financials are based on the most recent Mortgage that was taken out on this home.
Original Mortgage
$385,000
Outstanding Balance
$89,499
Interest Rate
3.92%
Mortgage Type
Future Advance Clause Open End Mortgage
Estimated Equity
$26,501
Purchase Details
Closed on
Feb 22, 2005
Sold by
H I Properties Llc
Bought by
Kidd Gregory C
Home Financials for this Owner
Home Financials are based on the most recent Mortgage that was taken out on this home.
Original Mortgage
$48,750
Interest Rate
5.67%
Mortgage Type
Future Advance Clause Open End Mortgage
Purchase Details
Closed on
Dec 1, 1997
Sold by
Decker Arlo
Bought by
Harmon John
Purchase Details
Closed on
Jul 22, 1992
Bought by
Decker Arlo G
Create a Home Valuation Report for This Property
The Home Valuation Report is an in-depth analysis detailing your home's value as well as a comparison with similar homes in the area
Home Values in the Area
Average Home Value in this Area
Purchase History
| Date | Buyer | Sale Price | Title Company |
|---|---|---|---|
| H I Properties Llc | -- | None Available | |
| Kidd Gregory C | -- | First Services Title Agency | |
| Harmon John | $18,000 | -- | |
| Decker Arlo G | -- | -- |
Source: Public Records
Mortgage History
| Date | Status | Borrower | Loan Amount |
|---|---|---|---|
| Open | H I Properties Llc | $385,000 | |
| Previous Owner | Kidd Gregory C | $48,750 |
Source: Public Records
Tax History Compared to Growth
Tax History
| Year | Tax Paid | Tax Assessment Tax Assessment Total Assessment is a certain percentage of the fair market value that is determined by local assessors to be the total taxable value of land and additions on the property. | Land | Improvement |
|---|---|---|---|---|
| 2024 | $599 | $17,470 | $5,950 | $11,520 |
| 2023 | $527 | $14,320 | $4,870 | $9,450 |
| 2022 | $538 | $14,320 | $4,870 | $9,450 |
| 2021 | $519 | $14,320 | $4,870 | $9,450 |
| 2020 | $510 | $13,480 | $4,590 | $8,890 |
| 2019 | $510 | $13,480 | $4,590 | $8,890 |
| 2018 | $515 | $13,480 | $4,590 | $8,890 |
| 2017 | $437 | $11,630 | $4,590 | $7,040 |
| 2016 | $430 | $11,630 | $4,590 | $7,040 |
| 2015 | $441 | $11,630 | $4,590 | $7,040 |
| 2014 | $441 | $11,980 | $4,800 | $7,180 |
| 2013 | $450 | $11,980 | $4,800 | $7,180 |
Source: Public Records
Map
Nearby Homes
- 714 Briggs Ave Unit 1
- 425 N Main St
- 408 N Mulberry St
- 213 N Pearl St
- 316 E 4th St
- 336 W 4th St
- 409 W 4th St
- 123 Oakland Ave
- 440 W 4th St
- 406 S Mulberry St
- 521 S Broadway St
- 00 Kleinoeder Rd
- 14101 Allentown Rd
- 5354 Ohio 197
- 21302 Masters Rd
- 21197 Ohio 116
- 21183 Ohio 116
- 22284 Ohio 198
- 7470 Fort Amanda Rd
- 1069 S Kemp Rd
- 714 N Broadway St
- 704 N Broadway St
- 711 Briggs Ave
- 707 Briggs Ave
- 715 Briggs Ave
- 808 N Broadway St
- 715 N Broadway St
- 707 N Broadway St
- 125 E Union St
- 703 N Broadway St
- 628 N Broadway St
- 811 N Broadway St
- 631 N Broadway St
- 812 N Broadway St
- 124 E Union St
- 101 W Union St
- 710 Briggs Ave
- 706 Briggs Ave
- 201 E Union St