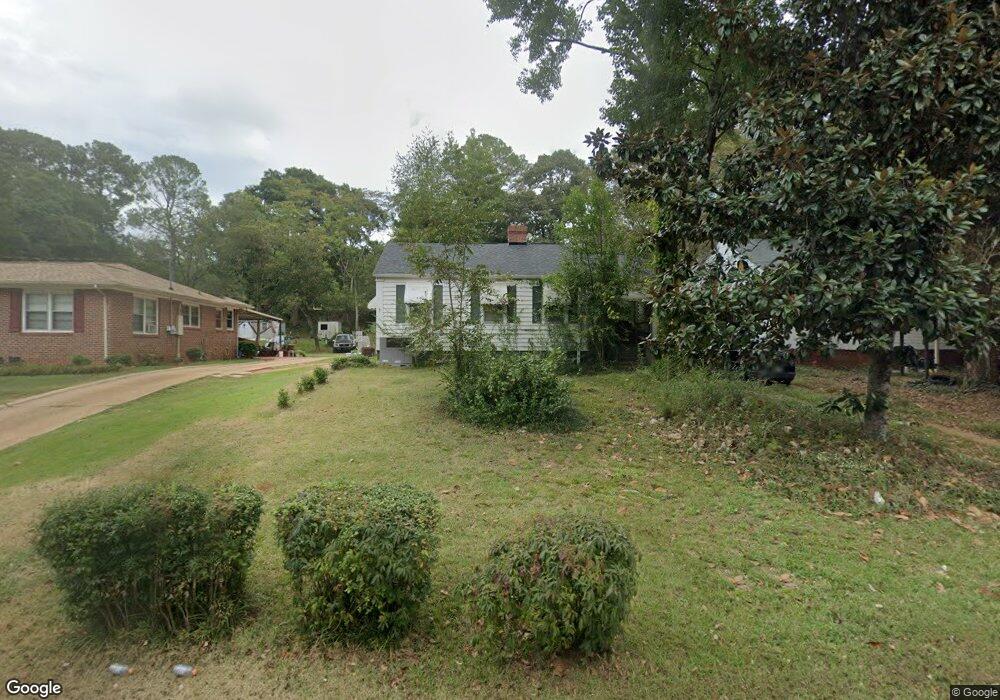
710 N Greenwood St Lagrange, GA 30240
Estimated Value: $88,000 - $116,000
2
Beds
1
Bath
801
Sq Ft
$133/Sq Ft
Est. Value
About This Home
This home is located at 710 N Greenwood St, Lagrange, GA 30240 and is currently estimated at $106,839, approximately $133 per square foot. 710 N Greenwood St is a home located in Troup County with nearby schools including Franklin Forest Elementary School, Hollis Hand Elementary School, and Ethel W. Kight Elementary School.
Ownership History
Date
Name
Owned For
Owner Type
Purchase Details
Closed on
Apr 29, 2015
Sold by
Knight Barbara
Bought by
Knight Ronald D
Current Estimated Value
Purchase Details
Closed on
Jul 20, 1995
Sold by
Cora B Knight
Bought by
Knight Ernest J
Purchase Details
Closed on
Nov 13, 1984
Sold by
Johnson Albert C
Bought by
Cora B Knight
Purchase Details
Closed on
Jan 25, 1983
Sold by
Johnson Cheryl Paden
Bought by
Johnson Albert C
Purchase Details
Closed on
Sep 3, 1982
Sold by
Bertlshofer John C
Bought by
Johnson Cheryl Paden
Purchase Details
Closed on
Aug 12, 1982
Sold by
Charter Federal
Bought by
Bertlshofer John C
Purchase Details
Closed on
Nov 24, 1981
Sold by
Bertlshofer Mary A
Bought by
Charter Federal
Purchase Details
Closed on
Jul 20, 1979
Sold by
S C R Realty Co
Bought by
Bertlshofer Mary A
Purchase Details
Closed on
May 1, 1967
Sold by
Rainey S C
Bought by
S C R Realty Co
Create a Home Valuation Report for This Property
The Home Valuation Report is an in-depth analysis detailing your home's value as well as a comparison with similar homes in the area
Home Values in the Area
Average Home Value in this Area
Purchase History
| Date | Buyer | Sale Price | Title Company |
|---|---|---|---|
| Knight Ronald D | $41,000 | -- | |
| Knight Ernest J | -- | -- | |
| Cora B Knight | $29,900 | -- | |
| Johnson Albert C | -- | -- | |
| Johnson Cheryl Paden | $28,000 | -- | |
| Bertlshofer John C | -- | -- | |
| Charter Federal | -- | -- | |
| Bertlshofer Mary A | -- | -- | |
| S C R Realty Co | -- | -- |
Source: Public Records
Tax History Compared to Growth
Tax History
| Year | Tax Paid | Tax Assessment Tax Assessment Total Assessment is a certain percentage of the fair market value that is determined by local assessors to be the total taxable value of land and additions on the property. | Land | Improvement |
|---|---|---|---|---|
| 2024 | $865 | $31,720 | $3,320 | $28,400 |
| 2023 | $662 | $24,280 | $3,320 | $20,960 |
| 2022 | $653 | $23,400 | $3,320 | $20,080 |
| 2021 | $556 | $18,440 | $3,320 | $15,120 |
| 2020 | $556 | $18,440 | $3,320 | $15,120 |
| 2019 | $516 | $17,120 | $3,320 | $13,800 |
| 2018 | $516 | $17,120 | $3,320 | $13,800 |
| 2017 | $507 | $16,800 | $3,000 | $13,800 |
| 2016 | $493 | $16,358 | $3,000 | $13,358 |
| 2015 | $505 | $16,708 | $3,350 | $13,358 |
| 2014 | -- | $16,006 | $3,350 | $12,656 |
| 2013 | -- | $16,570 | $3,332 | $13,238 |
Source: Public Records
Map
Nearby Homes
- 219 Banks St
- 109 Thomas St
- 0 Ridley Ave Unit 10550104
- 609 Ridley Ave
- 707 Ridley Ave
- 611 Ridley Ave
- 615 Ridley Ave
- 709 Ridley Ave
- 900 North St
- 145 Turner St
- 301 E Bacon St
- 110 Russell St
- 105 Saynor Cir
- 109 Dogwood Dr
- 204 Colonial St
- 102 Ewing St
- 748 Lakewood Dr
- 106 Ewing St
- 705 Piney Woods Dr
- 724 Camellia Dr
- 708 N Greenwood St
- 706 N Greenwood St
- 712 N Greenwood St
- 704 N Greenwood St
- 727 N Greenwood St
- 726 N Greenwood St
- 640 N Greenwood St
- 728 N Greenwood St
- 729 N Greenwood St
- 700 N Greenwood St
- 259 Beechwood Cir
- 259 Beechwood Cir Unit 7 & 10
- 257 Beechwood Cir Unit 11
- 257 Beechwood Cir
- 201 Thomas St
- 261 Beechwood Cir
- 142 Mitchell Ave
- 209 Thomas St
- 621 N Greenwood St
- 255 Beechwood Cir