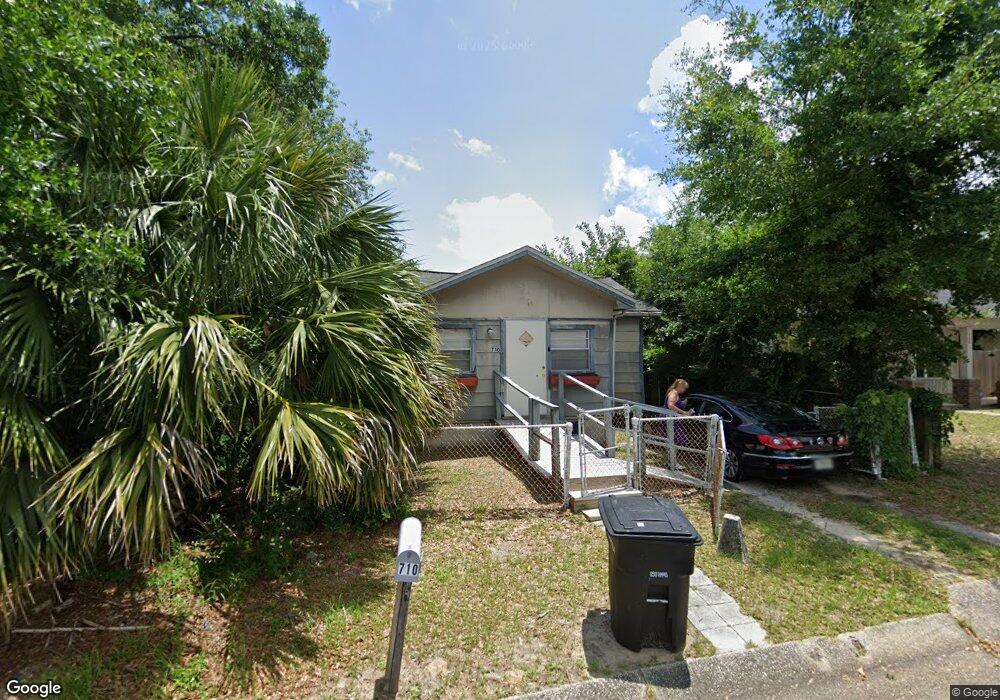
710 N H St Pensacola, FL 32501
Estimated Value: $92,000 - $212,000
--
Bed
1
Bath
704
Sq Ft
$200/Sq Ft
Est. Value
About This Home
This home is located at 710 N H St, Pensacola, FL 32501 and is currently estimated at $140,481, approximately $199 per square foot. 710 N H St is a home located in Escambia County with nearby schools including Warrington Middle School, Pensacola High School, and Escambia Christian School.
Ownership History
Date
Name
Owned For
Owner Type
Purchase Details
Closed on
Jul 1, 2016
Bought by
Nkw Pensacola Llc
Current Estimated Value
Purchase Details
Closed on
Jun 1, 2016
Bought by
Nkw Pensacola Llc
Purchase Details
Closed on
Jan 16, 2007
Sold by
Johnson Harmon and Johnson Mattie M
Bought by
Captain Svein Llc
Home Financials for this Owner
Home Financials are based on the most recent Mortgage that was taken out on this home.
Original Mortgage
$40,800
Interest Rate
6.05%
Mortgage Type
Purchase Money Mortgage
Create a Home Valuation Report for This Property
The Home Valuation Report is an in-depth analysis detailing your home's value as well as a comparison with similar homes in the area
Home Values in the Area
Average Home Value in this Area
Purchase History
| Date | Buyer | Sale Price | Title Company |
|---|---|---|---|
| Nkw Pensacola Llc | $359,000 | -- | |
| Nkw Pensacola Llc | $548,100 | -- | |
| Captain Svein Llc | $30,000 | Attorney |
Source: Public Records
Mortgage History
| Date | Status | Borrower | Loan Amount |
|---|---|---|---|
| Previous Owner | Captain Svein Llc | $40,800 |
Source: Public Records
Tax History Compared to Growth
Tax History
| Year | Tax Paid | Tax Assessment Tax Assessment Total Assessment is a certain percentage of the fair market value that is determined by local assessors to be the total taxable value of land and additions on the property. | Land | Improvement |
|---|---|---|---|---|
| 2024 | $692 | $47,774 | $16,974 | $30,800 |
| 2023 | $692 | $35,798 | $0 | $0 |
| 2022 | $614 | $37,331 | $11,316 | $26,015 |
| 2021 | $550 | $29,586 | $0 | $0 |
| 2020 | $495 | $26,898 | $0 | $0 |
| 2019 | $476 | $25,633 | $0 | $0 |
| 2018 | $448 | $24,198 | $0 | $0 |
| 2017 | $411 | $21,136 | $0 | $0 |
| 2016 | $408 | $20,713 | $0 | $0 |
| 2015 | $413 | $20,690 | $0 | $0 |
| 2014 | $404 | $20,054 | $0 | $0 |
Source: Public Records
Map
Nearby Homes