Estimated Value: $50,000 - $98,000
4
Beds
2
Baths
2,404
Sq Ft
$31/Sq Ft
Est. Value
About This Home
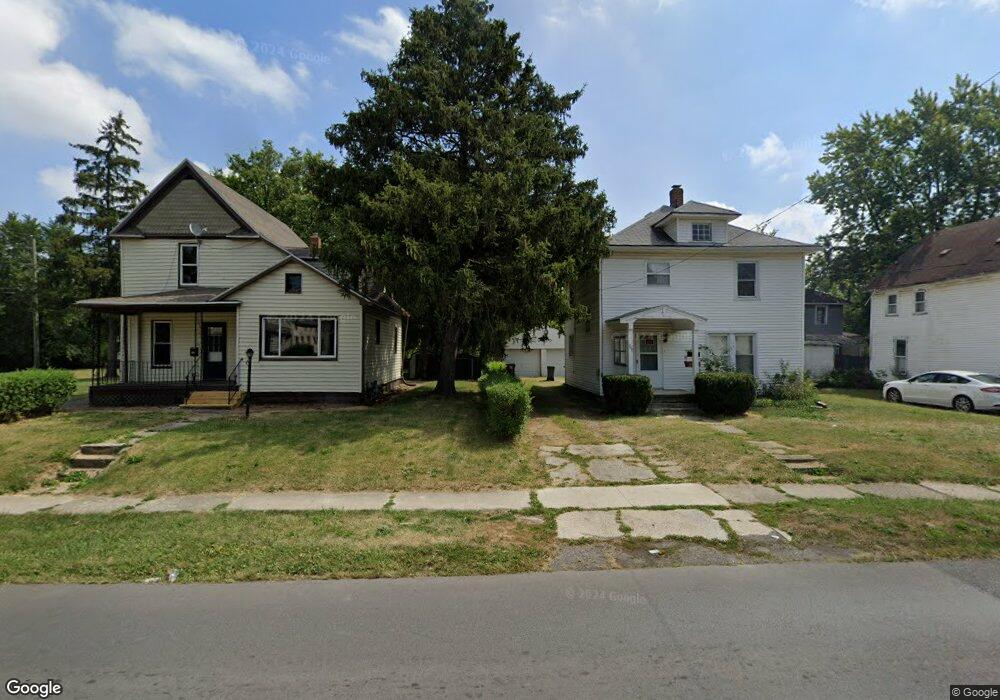
This home is located at 710 N Metcalf St, Lima, OH 45801 and is currently estimated at $73,500, approximately $30 per square foot. 710 N Metcalf St is a home located in Allen County with nearby schools including Independence Elementary School, Lima North Middle School, and Lima West Middle School.
Ownership History
Date
Name
Owned For
Owner Type
Purchase Details
Closed on
May 3, 2019
Sold by
Harshbarger Properties Llc
Bought by
Ohca Partners Ltd
Current Estimated Value
Home Financials for this Owner
Home Financials are based on the most recent Mortgage that was taken out on this home.
Original Mortgage
$722,000
Interest Rate
4.2%
Mortgage Type
Unknown
Purchase Details
Closed on
Aug 1, 2014
Sold by
Hunte Sandra L
Bought by
Harshbarger Properties Llc
Purchase Details
Closed on
Jun 28, 2005
Sold by
Harshbarger John D and Harshbarger Terri
Bought by
Hunte Sandra L
Home Financials for this Owner
Home Financials are based on the most recent Mortgage that was taken out on this home.
Original Mortgage
$40,500
Interest Rate
10.22%
Mortgage Type
Adjustable Rate Mortgage/ARM
Purchase Details
Closed on
Jul 3, 1984
Bought by
Harshbarger John D
Create a Home Valuation Report for This Property
The Home Valuation Report is an in-depth analysis detailing your home's value as well as a comparison with similar homes in the area
Home Values in the Area
Average Home Value in this Area
Purchase History
| Date | Buyer | Sale Price | Title Company |
|---|---|---|---|
| Ohca Partners Ltd | $737,800 | None Available | |
| Harshbarger Properties Llc | $2,000 | None Available | |
| Hunte Sandra L | $45,000 | Rrr Title Agency Inc | |
| Harshbarger John D | $15,000 | -- |
Source: Public Records
Mortgage History
| Date | Status | Borrower | Loan Amount |
|---|---|---|---|
| Closed | Ohca Partners Ltd | $722,000 | |
| Previous Owner | Hunte Sandra L | $40,500 |
Source: Public Records
Tax History Compared to Growth
Tax History
| Year | Tax Paid | Tax Assessment Tax Assessment Total Assessment is a certain percentage of the fair market value that is determined by local assessors to be the total taxable value of land and additions on the property. | Land | Improvement |
|---|---|---|---|---|
| 2024 | $569 | $14,320 | $980 | $13,340 |
| 2023 | $579 | $12,780 | $880 | $11,900 |
| 2022 | $581 | $12,780 | $880 | $11,900 |
| 2021 | $614 | $12,780 | $880 | $11,900 |
| 2020 | $701 | $13,130 | $810 | $12,320 |
| 2019 | $701 | $13,130 | $810 | $12,320 |
| 2018 | $693 | $13,130 | $810 | $12,320 |
| 2017 | $703 | $13,130 | $810 | $12,320 |
| 2016 | $713 | $13,130 | $810 | $12,320 |
| 2015 | $311 | $13,170 | $810 | $12,360 |
| 2014 | $311 | $14,420 | $770 | $13,650 |
| 2013 | $1,034 | $14,420 | $770 | $13,650 |
Source: Public Records
Map
Nearby Homes
- 612 N Metcalf St
- 416 Hazel Ave
- 745 Richie Ave
- 434 N Washington St
- 627 Brice Ave
- 631 Hazel Ave
- 607 W Grand Ave
- 638 Hazel Ave
- 606 N West St
- 745 Brice Ave
- 616 N Elizabeth St
- 325 N McDonel St
- 508 N Collett St
- 14 House Package
- 618 Woodward Ave
- 765 Ewing Ave
- 735 N Main St
- 676 Cortlandt Ave
- 722 N Elizabeth St
- 974 Richie Ave
- 708 N Metcalf St
- 714 N Metcalf St
- 700 N Metcalf St
- 718 N Metcalf St
- 468 Haller St
- 464 Haller St
- 504 Haller St
- 709 N Metcalf St
- 711 N Metcalf St
- 460 Haller St
- 715 N Metcalf St
- 506 Haller St
- 642 N Metcalf St
- 728 N Metcalf St
- 459 Julian Ct
- 459 Julian Ave
- 456 Haller St
- 719 N Metcalf St
- 512 Haller St
- 467 Haller St