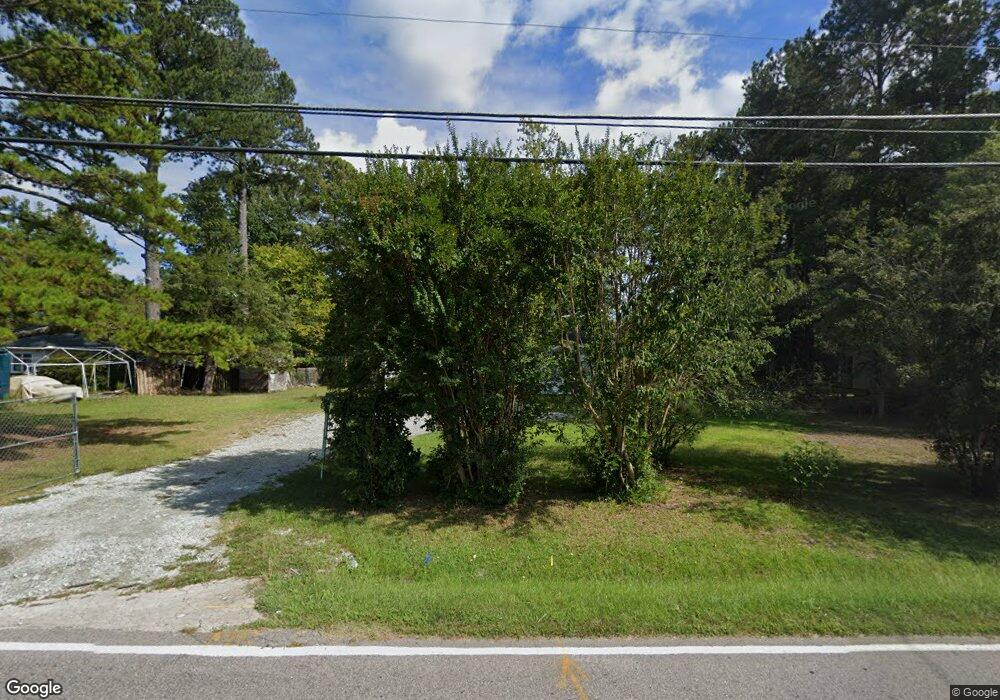
710 N Mineral Springs Rd Durham, NC 27703
Eastern Durham NeighborhoodEstimated Value: $237,000 - $330,000
3
Beds
2
Baths
1,300
Sq Ft
$219/Sq Ft
Est. Value
About This Home
This home is located at 710 N Mineral Springs Rd, Durham, NC 27703 and is currently estimated at $284,411, approximately $218 per square foot. 710 N Mineral Springs Rd is a home located in Durham County with nearby schools including Glenn Elementary, John W Neal Middle School, and Southern School of Energy & Sustainability.
Ownership History
Date
Name
Owned For
Owner Type
Purchase Details
Closed on
Apr 18, 2013
Sold by
Slf Help Credit Union
Bought by
Pena Jose David and Goldamez Aracely Yasmina
Current Estimated Value
Purchase Details
Closed on
Mar 19, 2013
Sold by
Mejia Jesus Mejia and Leon Martinez Alicia
Bought by
Self Help Credit Union
Purchase Details
Closed on
Jun 28, 2006
Sold by
Weaver Family Properties
Bought by
Mejia Jesus Mejia and Leon Martinez Alicia
Home Financials for this Owner
Home Financials are based on the most recent Mortgage that was taken out on this home.
Original Mortgage
$119,300
Interest Rate
6.57%
Mortgage Type
Purchase Money Mortgage
Purchase Details
Closed on
Jun 1, 2006
Sold by
Weaver Family Properties Llc
Bought by
Fung Shu Fai
Home Financials for this Owner
Home Financials are based on the most recent Mortgage that was taken out on this home.
Original Mortgage
$119,300
Interest Rate
6.57%
Mortgage Type
Purchase Money Mortgage
Purchase Details
Closed on
Dec 1, 2005
Sold by
Manufacturers & Traders Trust Co
Bought by
Weaver Family Properties
Purchase Details
Closed on
Jul 6, 2005
Sold by
Mckenney Ronald M and Mckenney Vivian W
Bought by
Manufacturers & Traders Trust Co
Create a Home Valuation Report for This Property
The Home Valuation Report is an in-depth analysis detailing your home's value as well as a comparison with similar homes in the area
Home Values in the Area
Average Home Value in this Area
Purchase History
| Date | Buyer | Sale Price | Title Company |
|---|---|---|---|
| Pena Jose David | $56,000 | None Available | |
| Self Help Credit Union | $87,125 | None Available | |
| Mejia Jesus Mejia | $123,000 | None Available | |
| Fung Shu Fai | $3,000 | None Available | |
| Weaver Family Properties | $47,000 | -- | |
| Manufacturers & Traders Trust Co | $102,867 | -- |
Source: Public Records
Mortgage History
| Date | Status | Borrower | Loan Amount |
|---|---|---|---|
| Previous Owner | Mejia Jesus Mejia | $119,300 |
Source: Public Records
Tax History Compared to Growth
Tax History
| Year | Tax Paid | Tax Assessment Tax Assessment Total Assessment is a certain percentage of the fair market value that is determined by local assessors to be the total taxable value of land and additions on the property. | Land | Improvement |
|---|---|---|---|---|
| 2025 | $1,588 | $213,339 | $80,500 | $132,839 |
| 2024 | $1,273 | $114,478 | $32,280 | $82,198 |
| 2023 | $1,229 | $114,478 | $32,280 | $82,198 |
| 2022 | $1,193 | $114,478 | $32,280 | $82,198 |
| 2021 | $1,004 | $114,478 | $32,280 | $82,198 |
| 2020 | $981 | $114,478 | $32,280 | $82,198 |
| 2019 | $970 | $114,478 | $32,280 | $82,198 |
| 2018 | $893 | $96,712 | $32,280 | $64,432 |
| 2017 | $864 | $96,712 | $32,280 | $64,432 |
| 2016 | $837 | $96,712 | $32,280 | $64,432 |
| 2015 | $1,001 | $93,352 | $24,677 | $68,675 |
| 2014 | $1,005 | $93,352 | $24,677 | $68,675 |
Source: Public Records
Map
Nearby Homes
- 59 Enesco Cir
- 612 Chivalry Dr
- 3801 Tyne Dr
- 3507 Portico Ln
- 4807 Tyne Dr
- 521 Quartz Dr
- 31 S Angela Cir
- 5409 Hadrian Dr
- 507 Chivalry Dr
- 3615 Freeman Rd
- 4918 Tyne Dr
- 416 Chivalry Dr
- 214 Cloverdale Dr
- 1103 Kindness Ln
- 1114 Kindness Ln
- 1011 Homecoming Way
- 740 Obsidian Way
- 3602 Turquoise Dr
- 1060 Gentle Reed Dr
- 912 Obsidian Way
- 716 N Mineral Springs Rd
- 702 N Mineral Springs Rd
- 703 Whitby Ct
- 713 N Mineral Springs Rd
- 705 Whitby Ct
- 701 Whitby Ct
- 634 N Mineral Springs Rd
- 722 N Mineral Springs Rd
- 801 Whitby Ct
- 701 N Mineral Springs Rd
- 719 N Mineral Springs Rd
- 66 Enesco Cir
- 803 Whitby Ct
- 700 Whitby Ct
- 730 N Mineral Springs Rd
- 628 N Mineral Springs Rd
- 629 N Mineral Springs Rd
- 805 Whitby Ct
- 704 Whitby Ct
- 64 Enesco Cir